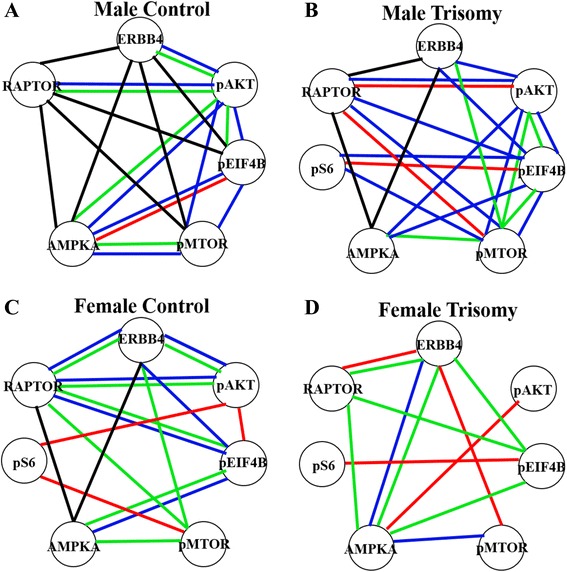
Fig. 6.

Correlation of levels of MTOR pathway components across brain regions. Correlation coefficients for proteins in each brain region and sex/genotype were determined using Spearman correlation analysis. Networks include only those protein pairs with r > 0.8 and p < 0.05, after manual inspection to exclude spurious linearities. Red correlations in hippocampus, blue cerebellum, green cortex, black all three brain regions. a Male controls. b Male Dp10. c Female controls. d Female Dp10
