
Fig. 7.
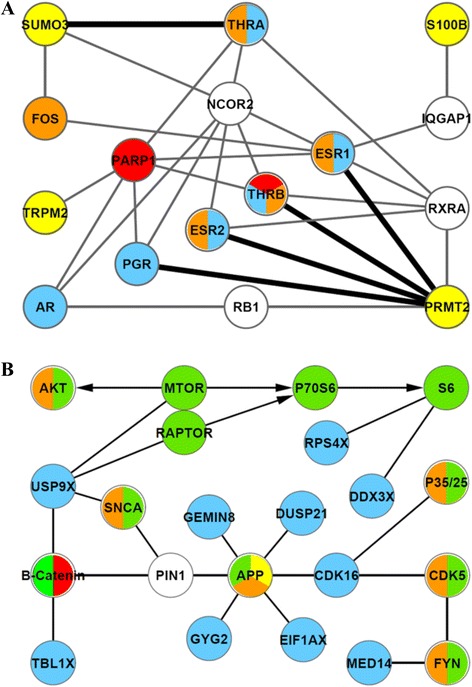
Protein interaction networks. Protein interactions, retrieved from curated public databases, are indicated by lines connecting two nodes. Nodes are color-coded: yellow Hsa21-encoded protein, red human ID protein [18], orange mouse LM protein (The Mammalian Phenotype Database). a Interactions between Hsa21 proteins and sex or thyroid hormone receptors (blue); heavy lines direct interactions with a Dp10 protein. b Interactions of RPPA proteins (green) that showed an abnormal level in at least one brain region/sex/genotype with X chromosome-encoded proteins (blue) that escape silencing by X inactivation [10–12]. Arrows indicate activation in the MTOR pathway