
Fig. 2.
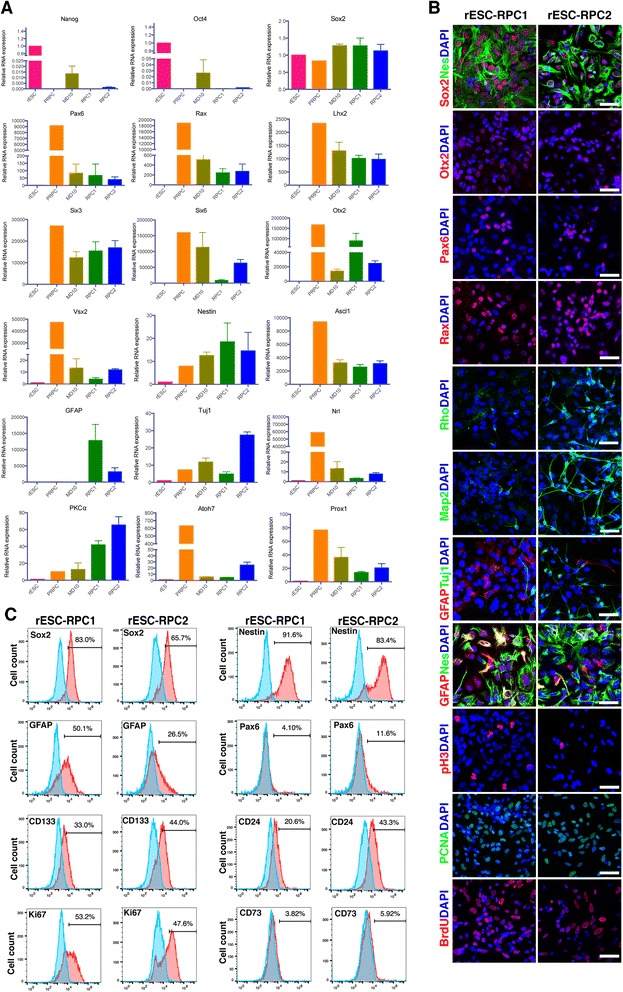
Characterization of rESC-RPCs at D16. a Comparisons of various marker expressions among rESCs, rESC-RPCs and other controls, including samples of differentiating rESCs at day 10 and P-RPCs. The relative mRNA levels of marker genes were determined by RT-qPCRs. Error bars represent the mean ± SD, n = 3. b Representative confocal immunofluorescence images of rESC-RPCs for NPC markers (Sox2, Nestin/Nes), anterior neural marker (Otx2), proliferation markers (pH3, PCNA and BrdU), retinal progenitor markers (Rax and Pax6), neuronal marker (Tuj1) and astrocyte and radial glia cell marker (GFAP). Scale bar: 50 μm. c Representative FCM profiles of rESC-RPCs for subpopulations expressing Sox2, Nestin, CD133, GFAP, Ki67, CD73 and CD24. Corresponding IgG was applied as the negative isotype control. rESC rat embryonic stem cell, RPCs retinal progenitor cells, RT-qPCR reverse transcription-quantitative polymerase chain reaction, NPC neural progenitor cell