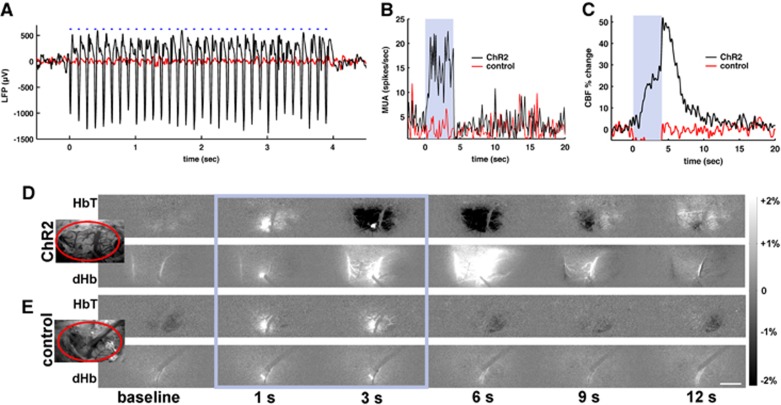
Figure 2.
Neurovascular responses to optogenetic stimulus. (A–C) Simultaneously recorded dataset from a channelrhodopsin (ChR2) rat (black traces) and a control rat (red traces) exposed to 4- second blue laser light (30 ms, 8 Hz, and 2.5 mW). In the ChR2 rat, the light stimulus induces an increase in local field potential (LFP) (A), multiunit activity (MUA) (B), and cerebral blood flow (C). Blue-dashed line or shaded area: light stimulus duration. Dual wavelength reflectance optical images were obtained from the exposed cortical surface (D, E). A small bright spot during the light stimulation period (within the blue rectangle) is due to fluorescence from YFP or mCherry at the light stimulation site. Insert: bright-field image of the forelimb primary somatosensory cortex (S1FL) area (inside the ellipse). In the ChR2 rat (D), light stimulation induced darkening in 570-nm reflectance images (top panel) indicating an increase of total hemoglobin (HbT) and brightening in 620-nm images (bottom panel) indicative of a decrease in deoxyhemoglobin (dHb). (E) Optical imaging data from a control animal exposed to the same light stimulus. No change of HbT (top panel) or dHb (bottom panel) was observed. Scale bar=1 mm.

