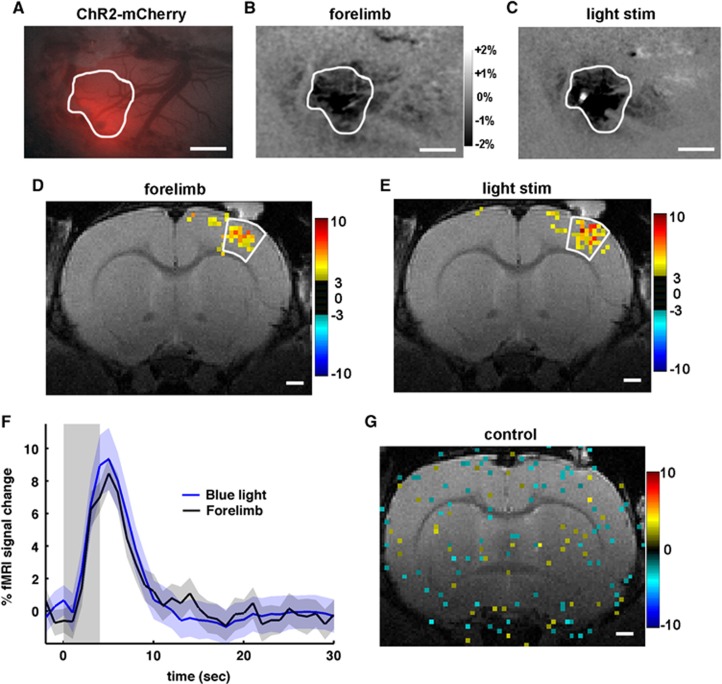
Figure 4.
Correspondence of activation sites and temporal blood oxygenation level-dependent (BOLD) functional magnetic resonance imaging (fMRI) responses between forelimb (1 ms, 8 Hz, and 1.5 mA) and channelrhodopsin (ChR2) stimulation (30 ms, 8 Hz, and 10 mW). Example of a ChR2-mCherry expression site seen as an increase in the red fluorescence (A) was activated during forelimb sensory stimulation (B) and light stimulation (C), demonstrating that the expression site is the primary forelimb area. The same region is outlined on (A–C). In 570-nm optical intrinsic signal (OIS) maps (B, C), darkening indicates an increase in total hemoglobin (HbT) contents, and a bright small spot (C) is an artifact of light stimulation. Scale bar=1 mm. Similarly, in the BOLD fMRI, the forelimb sensory cortical area responding to forelimb stimulation (D) was also active during light stimulation (E). Time courses were obtained from active pixels with t>3 (P<0.01) within the white-contoured forelimb area, and similar temporal behavior was observed in the group data (n=4, shaded range: s.e.m.) for 4- second light (blue) and forelimb (black) stimulation (F). One of the controls is shown in (G), no significant activation was detected even in the low threshold map (P<0.05) at the highest stimulation light energy (30 ms, 8 Hz, and 20 mW). Color bars in (D, E, and G): t-values. Scale bar=1 mm.

