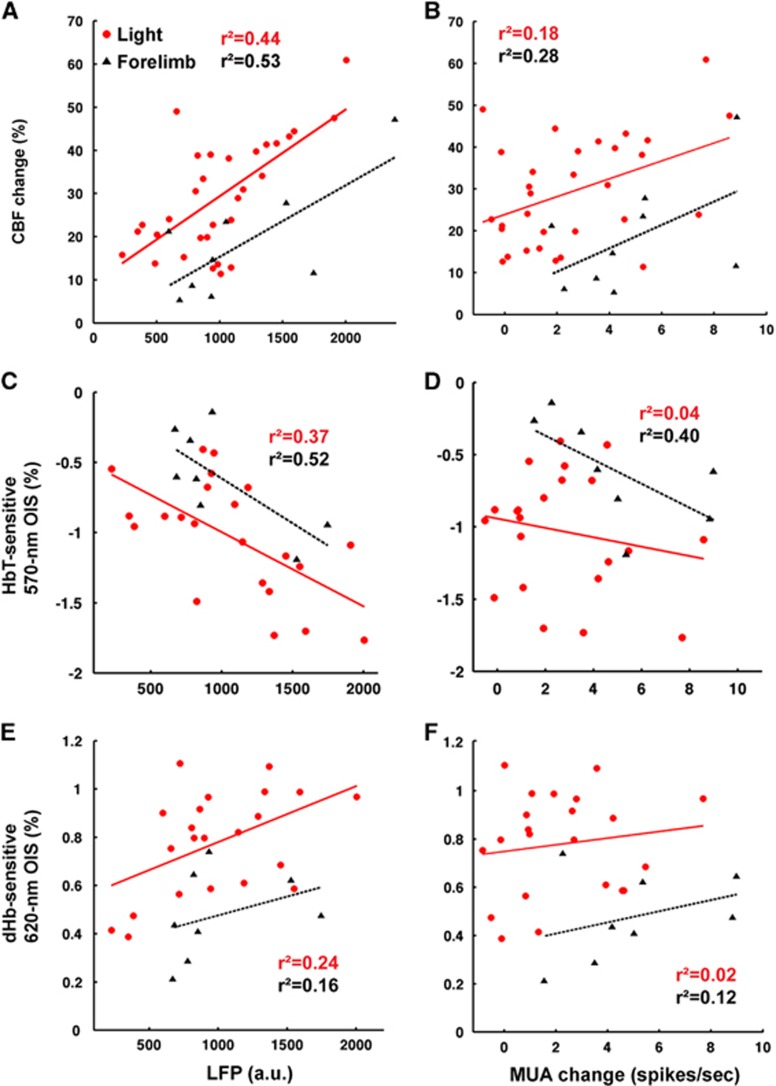
Figure 6.
Correlation between neural activity and simultaneously acquired hemodynamic responses. The number of data points for light stimulation (red) was 31 from 5 animals for cerebral blood flow (CBF) and 22 from 4 animals for total hemoglobin (HbT) and deoxyhemoglobin (dHb), while data for sensory stimulation (black) included control animals, which were 9 for CBF and 8 for HbT and dHb. Local field potentials (A, C, E) and multiunit activities (B, D, F) were plotted against CBF (A, B), HbT-weighted optical intrinsic signal (OIS) (C, D), and dHb-weighted OIS (E, F). The best linear fit is shown with the corresponding R2 value.

