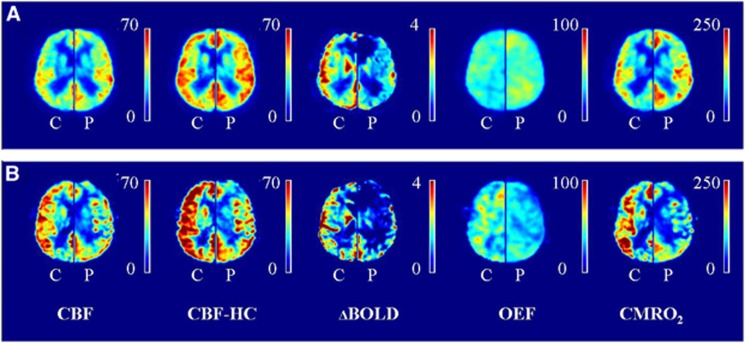
Figure 1.
Hemodynamic maps. (A) Mean maps of all patients (P) without delayed arrival artifacts (DAAs) are shown (left hemisphere), mean maps of their corresponding controls (C, right hemisphere). (B) Mean maps of the patients with DAA (P, left hemisphere) and their corresponding controls (C, right hemisphere). Delayed arrival artifacts are visible on the ASL images of the patients with DAA and this propagates to the OEF and CMRO2 maps. Note that the images of the control subjects of the patients with DAA (B, right hemispheres) seem to have higher values compared with the control subjects of the patients without DAA (A, right hemispheres). We hypothesize this to be caused by the fact that the right hemisphere in (B) shows the mean image of three controls while the right hemisphere in (A) shows the mean image of 11 controls which decreases the amount of variation on which the mean perfusion images are based. BOLD CVR, blood oxygen level-dependent cerebrovascular reactivity (% per 10 mm Hg ▵EtCO2); CBF, cerebral blood flow (in mL/100 g per minute); CBF-HC, cerebral blood flow during hypercapnia (in mL/100 g per minute); CMRO2, cerebral metabolic rate of oxygen (in μmol/100 g per minute); OEF, oxygen extraction fraction (in %).

