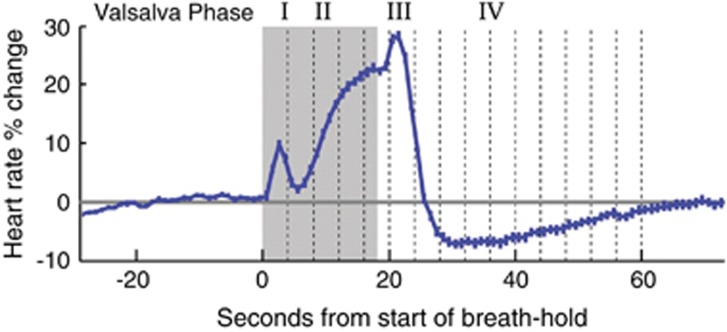
Figure 1.
Heart rate changes during the four phases of the Valsalva maneuver. Mean and standard deviation of 4 Valsalva maneuvers across 57 volunteers. The gray-shaded area marks the breath holding period. These data were collected as part of another study, and the figure is adapted from a previously published figure.26

