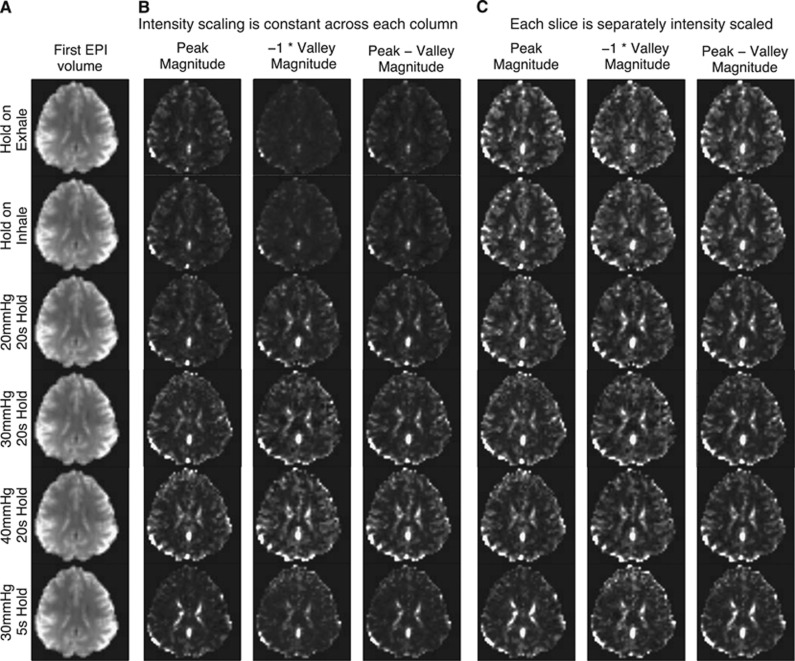
Figure 4.
Comparison of magnetic resonance imaging (MRI) signal magnitudes during breath holding and Valsalva conditions. The intensity scale of runs from 2% (black) to 98% (white) of the cumulative distribution of the magnitudes. (A) The first EPI volume of each run. (B) The intensity scale is constant across each column. The raw magnitudes change within trial type, but the relative tissue contrast remains similar. (C) The intensity scale is calculated separately for each slice. The maps of peak magnitude, −1*valley magnitude, and the difference between peak and valley magnitudes appears similar across breath hold and Valsalva conditions, even when the Valsalva maneuver duration is only 5 seconds.

