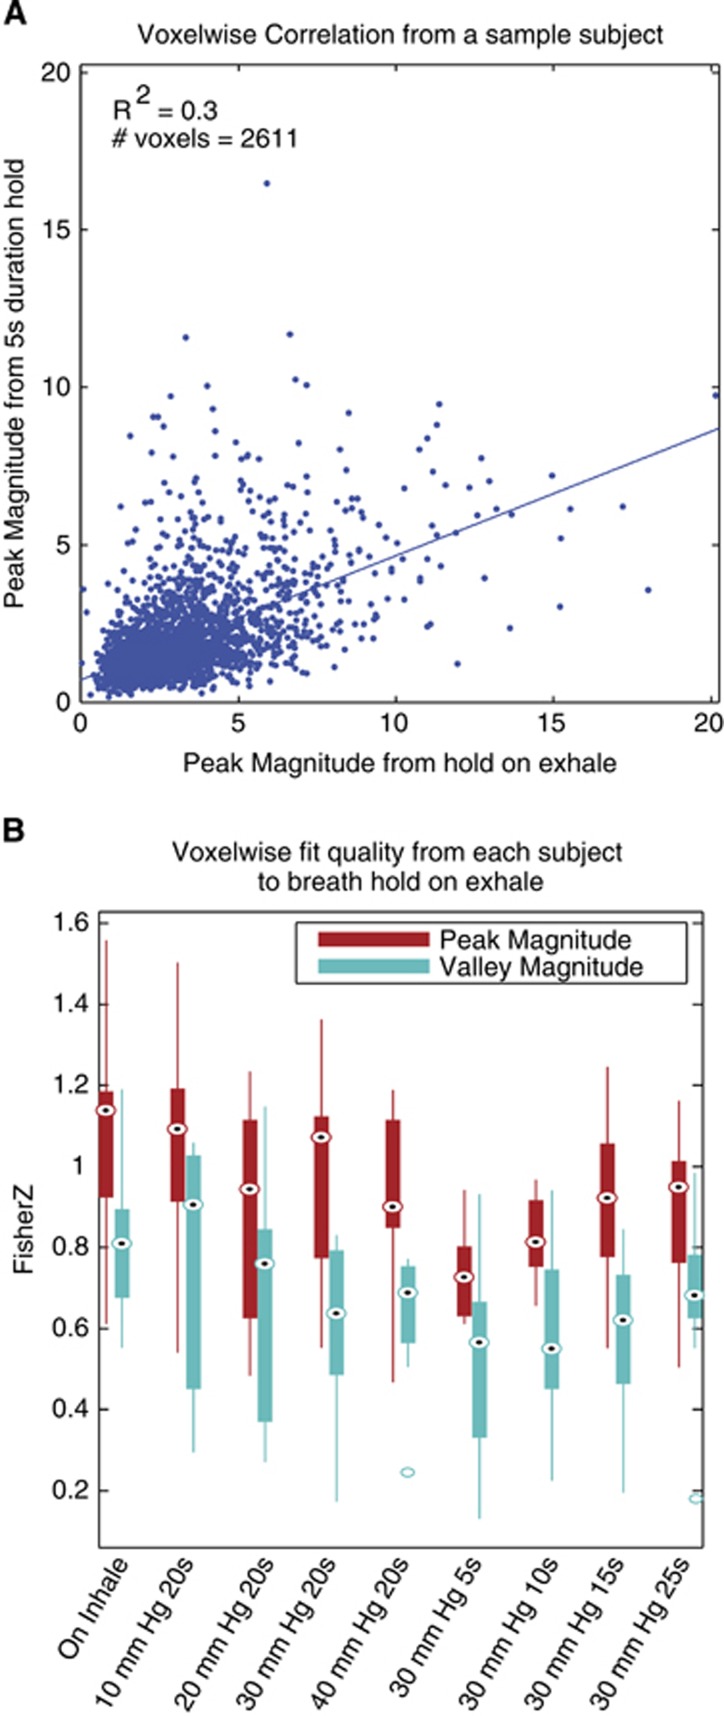
Figure 6.
Voxelwise relationships between trials. (A) The relationship between the peak magnitudes for a 20-second breath hold on exhalation (no pressure target) versus a 5-second hold at 30 mm Hg. The subject with the lowest r2 value for this fit is shown. Each point represents a gray-matter voxel. The linear fit to all voxelwise data is shown. (B) For each trial, compared with breath hold on exhalation, the r values from the regressions shown in (A) were Fisher Z-transformed and averaged across subjects. Box plots show the median (circle with dot), 25th and 75th percentiles (solid box), maxima and minima (whiskers) and outliers (hollow circles). Every fit is significant.

