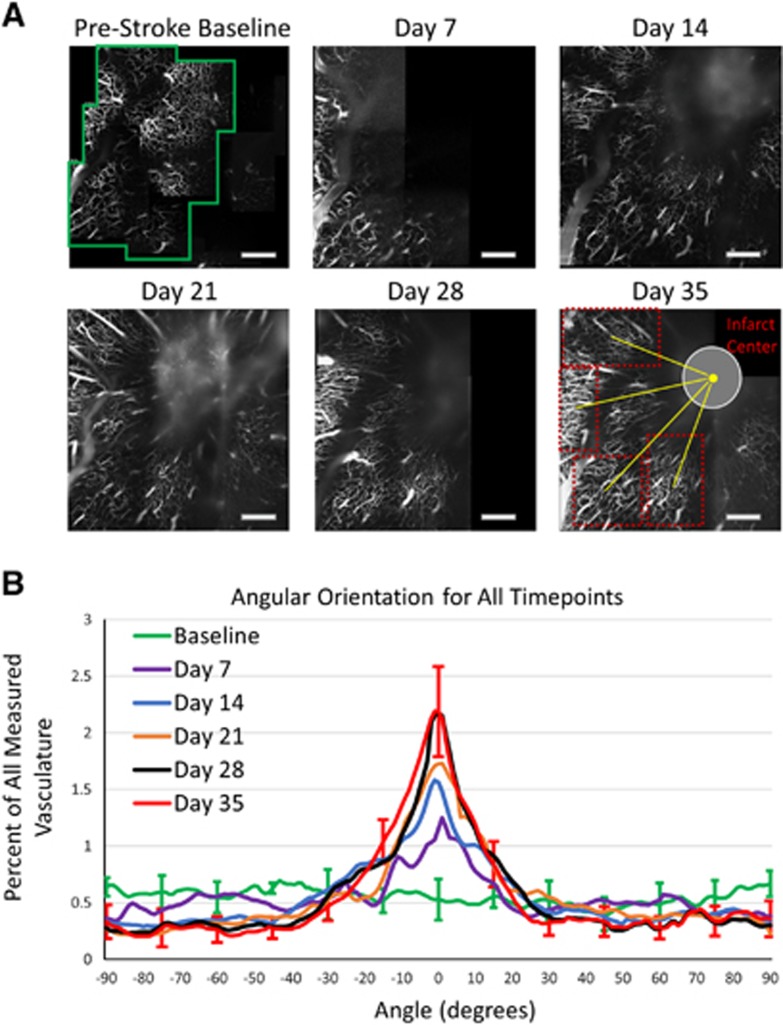
Figure 6.
(A) Two-photon microscopy projections from 151 to 200 μm of vascular progression during poststroke period. The green box denotes one of the regions included in the orientation analysis of healthy baseline vascular stack. The red boxes on Day 35 highlight four regions of interest used for orientation analysis, with the yellow lines denoting the angles between the center of the region and the infarct center. This angle, dependent on the region, is defined 0° in order to create a distribution of postocclusion regions from all animals together based on their position around the infarct center. Scale bar=500 μm. (B) Plot of angular orientations for all subsurface depth sections (M±s.d.) for baseline (24 regions, n=6), Day 7 (10 regions, n=3), Day 14 (18 regions, n=3), Day 21 (21 regions, n=6), Day 28 (20 regions, n=6), and Day 35 (20 regions, n=6) time points. Error bars included for baseline and Day 35 every 15°, with comparable error on remaining angles, excluded for figure clarity. The plot is centered on 0°, as this has been defined as the angle pointing toward the center of the infarct for postocclusion regions.

