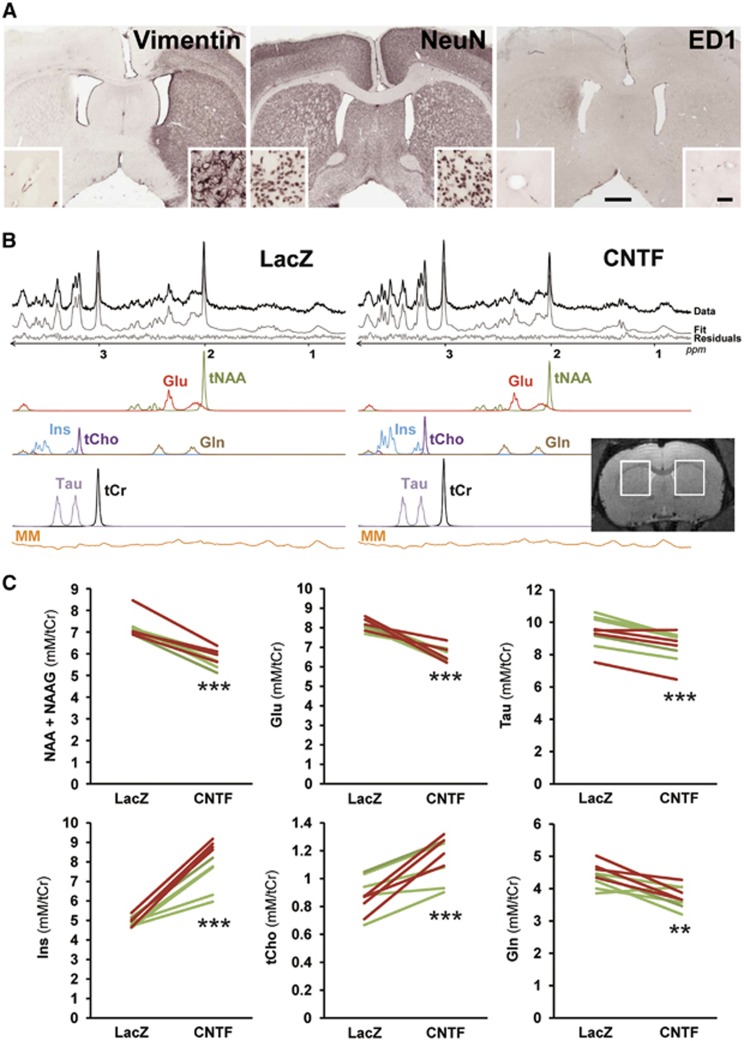
Figure 1.
Ciliary neurotrophic factor (CNTF) remodels striatal metabolite concentrations as measured by proton magnetic resonance spectroscopy (1H-MRS). (A) Representative images of immunostaining for vimentin, NeuN, and ED1/CD68. Vimentin is strongly induced in the lenti-CNTF injected striatum (right), but not in the lenti-LacZ striatum (left). At higher magnification, multiple reactive astrocytes are observed. There is no difference in the density or the morphology of neuronal cell bodies between the two striata. There is no positive staining for ED1/CD68, a selective marker of reactive microglia. Scale bar: 1 mm (large panels), 50 μm (small panels). (B) Representative in vivo 1H-MRS spectra obtained from the two striata, 2 months after lentiviral injection. Analysis by LCModel allows spectra decomposition into (1) neuronal metabolites (total NAA (tNAA=N-Acetyl-Aspartate (NAA)+ N-Acetyl-Aspartyl-Glutamate (NAAG)) and Glutamate (Glu)); (2) glial metabolites (Inositol (Ins), total Choline (tCho) and Glutamine (Gln)) (3) other metabolites (Taurine (Tau), total creatine (tCr), and macromolecules (MM)). Inset, representative T2-weighted image showing the position of the voxel (total volume=40.8 μL). There is no visible difference in T2 contrast between striata. (C) Metabolite concentrations measured in both voxels. Green lines correspond to rats injected with lenti-LacZ in the left striatum and lenti-CNTF in the right striatum; red lines correspond to rats injected with lenti-CNTF in the left striatum and lenti-LacZ in the right striatum. N=9; **P<0.01, ***P<0.001, paired t-test.

