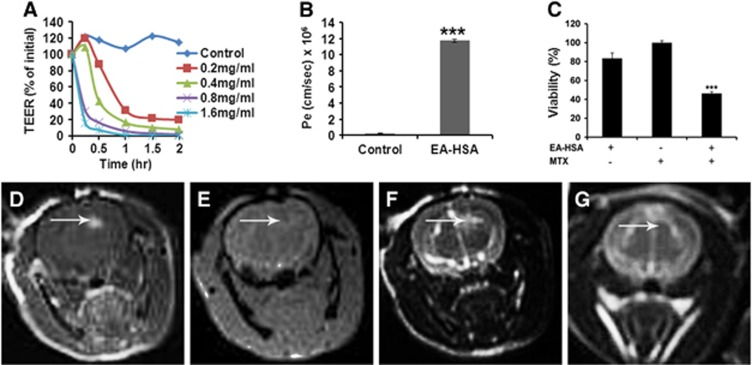
Figure 3.
In vitro and in vivo effects of EA–HSA. (A) In vitro barrier disruption as a function of time as reflected by the reduction in transendothelial electrical resistance (TEER) value (TEER at time 0>300 Ωcm2). (B) In vitro permeability (Pe) of methrotrexate (1 mmol/L) to the abluminal side in control (nontreated) porcine brain endothelial cells monolayer (PBEC-M) (left column) and in EA–HSA-treated PBEC-M (14 μmol/L, 2 hours at 37°C, right column). Data presented as the mean±s.e.m. values of 3 to 5 inserts per treatment. ***P<0.001 versus control. (C) Reduced glioma (CNS-1 cells) viability at the ‘brain' side (Figure 1) after treatment of PBEC-M with EA–HSA and Methotrexate (MTX) at the ‘blood' side in the ‘brain cancer-related in vitro experimental system'. Data presented as the mean±s.e.m. values of 4 inserts per treatment. ***P<0.001 versus controls. (D–G) Intracranial convection-enhanced drug delivery (CED) administration of EA–HSA in naive rats. EA–HSA at 20 μg/rat was infused into the rats brains. T1-weighted MR images acquired 30 minutes after treatment (D) are shown. Gradient-echo MR image acquired immediately post treatment (E). T2-weighted images acquired immediately after treatment (F) and T2-weighted images acquired 7 days after treatment (G). The images reflect blood–brain barrier (BBB) disruption (D, indicated by arrows), lack of hemorrhages (E) and tissue damage (F) or the lack of it (G) after 1 week. The T2-weighted MR images acquired immediately post CED (F) show enhancement in the treated region induced by the convective distribution of the infusate. EA, ethylamine; HSA, human serum albumin; CNS, central nervous system.

