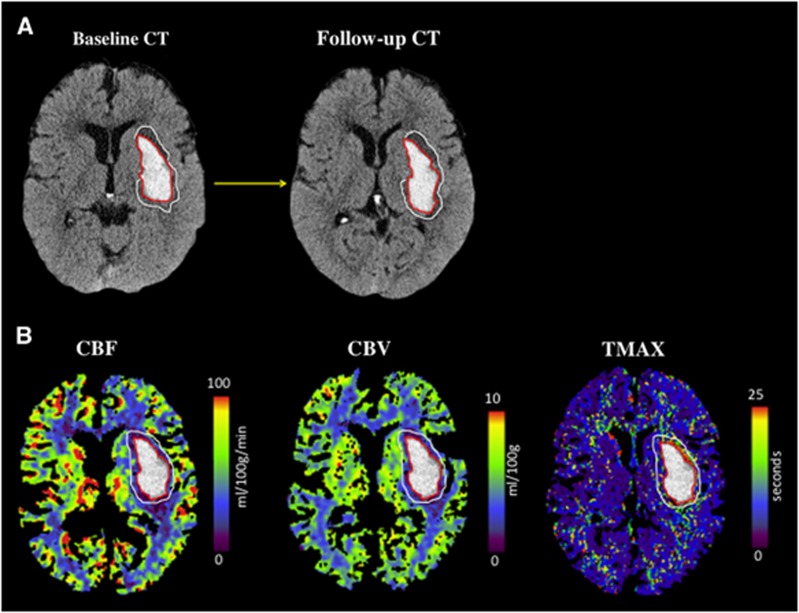
Figure 1.
(A) Example of hematoma and perihematoma edema regions of interest (ROIs). The ROIs were drawn on the noncontrast computed tomography (CT) and transferred to perfusion maps. (B) Maps of cerebral blood flow (CBF), cerebral blood volume (CBV), and time to peak of the impulse response curve (TMAX) from an ICH ADAPT study patient randomized to a target systolic BP <150 mm Hg.

