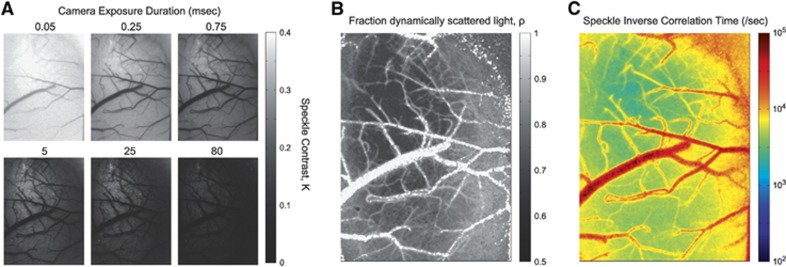
Figure 3.
(A) Speckle contrast images at six separate exposures exhibiting increased speckle visibility (e.g., contrast) at lower exposures and highlighting varying flow range sensitivity with exposure selection. (B) Fraction of collected light at each pixel scattered by moving particles (i.e., dynamically scattered light, ρ of Equation 3) and (C) corresponding inverse correlation time map extracted from fitting speckle contrast relationship with exposure duration, K(T), to the visibility expression in Equation 3.

