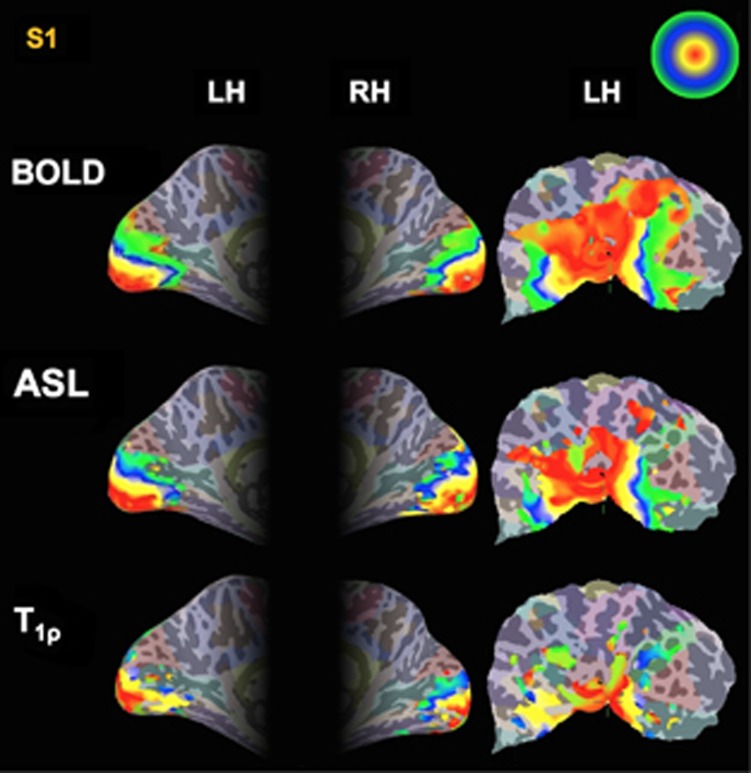
Figure 2.
Eccentricity phase maps of blood oxygenation level-dependent (BOLD), arterial spin labeling (ASL), and T1ρ response to the expanding-ring stimulus on the left and right inflated hemisphere, and the left flattened brain surface for single subject (S1). The color scale indicates the raw phase value between 0 and 2π for eccentricity map. The red color indicates regions corresponding to the center of field of view, while the green color regions correspond to the outer eccentric degrees.

