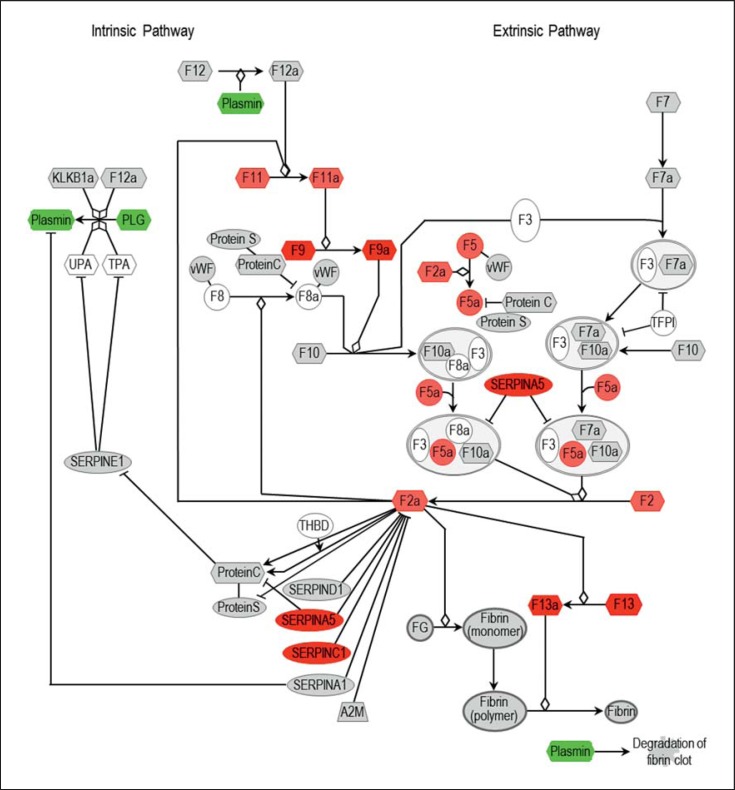
Fig. 3.
Schematic view of the coagulation cascade. Colored boxes highlight proteins with r ≥0.9 (dark red); r ≥0.8 (light red); r ≤-0.9 (green). Gray boxes: proteins were covered by the analysis, but displayed no significant correlation (0.8 ≥ r ≥ −0.8). A2M = α2-Macroglobulin; F2 = coagulation factor II; FG = fibrinogen; KLKB1a = plasma kallikrein; PLG = plasminogen; SERPINA1 = α1-antitrypsin; SERPINA5 = protein C inhibitor; SERPINC = antithrombin III; SERPIND1 = heparin cofactor II; TFPI = tissue factor pathway inhibitor; THBD = thrombomodulin; TPA = tissue plasminogen activator; UPA = urokinase plasminogen activator; VWF = von Willebrand factor.

