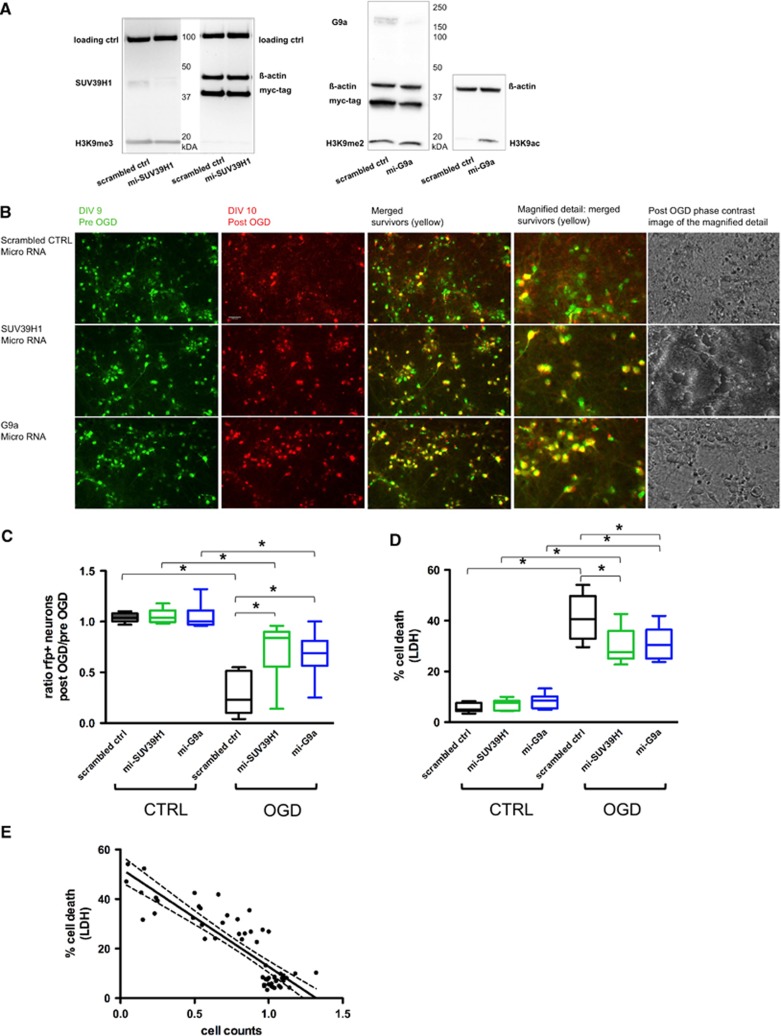
Figure 2.
Specific miRNA-based knockdown of histone methyltransferases SUV39H1 or G9a protects neurons subjected to oxygen glucose deprivation (OGD). (A) Representative immunoblots from day in vitro (DIV) 9, 8 days after lentiviral delivery. Left blot: knockdown of SUV39H1, same samples (scrambled ctrl and mi-SUV39H1) run twice on the same gel, incubated with anti-LSD1 (100 kb protein) and anti-ß-actin as loading controls, anti-Myc indicating transduction efficiency and anti-H3K9me3 detecting the product of SUV39H1 activity; right blot: knockdown of G9a, same samples (scrambled ctrl and mi-G9a) run twice, incubated with anti-ß-actin as a loading control, anti-Myc indicating transduction efficiency, anti-H3K9me2 and anti-H3K9ac as indicators of G9a activity. (B) Representative microscopic images of neuronal cultures transduced with microRNA-embedded short hairpin RNA (miR-shRNA) constructs (scrambled ctrl, mi-SUV39H1, mi-G9a); scale: 100 μm. Column 1: RFP fluorescence of cortical neurons before OGD (DIV 9) pseudo-colored in green; column 2: same region of interest (ROI) 24 hours after OGD (DIV 10), red fluorescent protein (RFP) fluorescence in red; column 3: merged images pre and post OGD, surviving neurons shown in yellow; column 4: magnified detail from the overlay image showing surviving neurons in yellow; column 5: phase-contrast image post OGD corresponding to the magnified detail image of column 4. (C) Ratio of mean cell counts per well post/pre OGD; RFP-positive cells were counted in a blinded manner. Per construct (scrambled ctrl, mi-SUV39H1, mi-G9a) and condition (CTRL/OGD) cells from 9 independent wells were counted and mean values of 10 ROIs calculated per well. Survival ratios of 1 represent a 100% survival rate. A two-way analysis of variance (ANOVA) was conducted that examined the effect of OGD and microRNA application on cell survival. There was a significant interaction between effects of OGD and microRNA, F(2,48)=8.7 with P<0.001 for interaction. A Tukey post hoc analysis was performed. Significant effects are indicated in the figure *P<0.001. (D) Lactate dehydrogenase (LDH) measurements 24 hours after OGD; N=9. A two-way ANOVA was conducted that examined the effect of OGD and microRNA treatment on cell survival. There was a significant interaction between effects of OGD and microRNA, F(2,48)=7.7 with P=0.001 for interaction. A Tukey post hoc analysis was performed. Significant effects are indicated in the figure *P<0.001. (E) Correlation of cell count data (survival) and the corresponding LDH measurement (% cell death) per well. Each dot represents one well (N=54). Included are all wells from all constructs (scrambled ctrl, mi-SUV39H1, mi-G9a) from OGD and control conditions. Person's r=−0.87, P<0.001.

