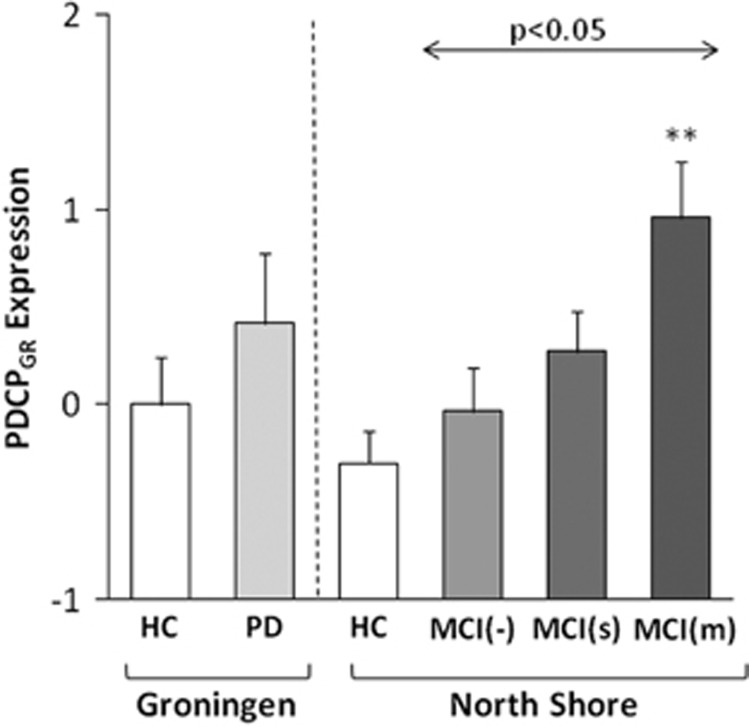
Figure 3.
Mean Groningen Parkinson's disease (PD)-related cognitive pattern (PDCPGR) expression in the derivation cohort of Groningen PD and healthy controls (HC) groups (left), as well as in the prospective cohort of North Shore PD subgroups and the corresponding HC group (right). There was a significant increase in PDCPGR expression across the North Shore MCI(−), MCI(s) and MCI(m) PD groups (F(2, 83)=3.95, P<0.05; one-way analysis of variance), with higher values (P<0.05; Tukey's HSD) in MCI(m) relative to MCI(−) subjects. **P<0.01, Student's t-test relative to the North Shore HC group. MCI, mild cognitive impairment.

