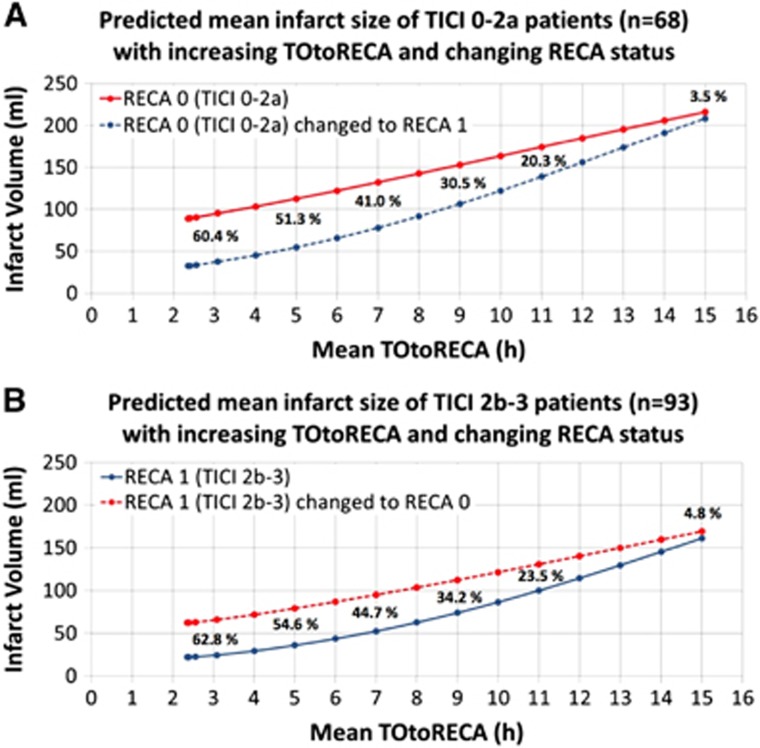
Figure 4.
Time curves of mean infarct volumes based on generalized linear model (GLM) prediction in patients with observed (A) TICI 0-2a and (B) TICI 2b-3 recanalization compared with infarct volumes when changing respective recanalization status within the model. Percentages indicate the relative volumetric difference (tissue benefit) of infarct volume RECA-0 versus RECA-1. The percent difference of infarct volume between RECA status ‘0' and ‘1' decreased from approximately 61% at 3 hours to <5% at 15 hours. RECA, recanalization.

