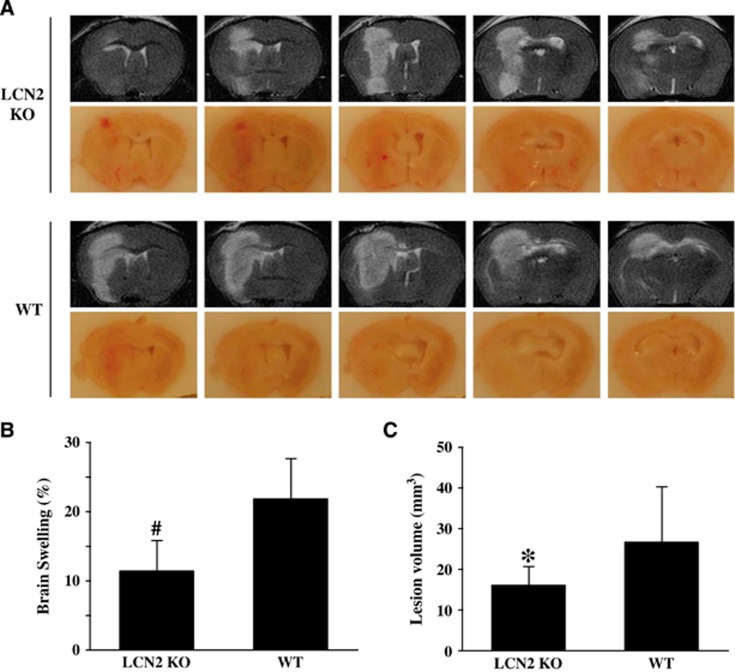
Figure 6.
Comparison of brain injury in wild-type (WT) and lipocalin-2 knockout (LCN2−/−) mice at 24 hours after 10 μL FeCl2 (1 mmol/L) was injected into the right basal ganglia. (A) Coronal sections of T2 magnetic resonance imaging (MRI) images and the frozen sections of mouse brains. (B) Brain swelling: ((ipsilateral–contralateral hemisphere)/contralateral hemisphere) × 100%. Values are means±s.d., n=10 to 11 for each group, #P<0.01 versus WT group. (C) MRI T2 lesion volumes. Values are mean±s.d., n=10 to 11 for each group, *P<0.05 versus WT group.

