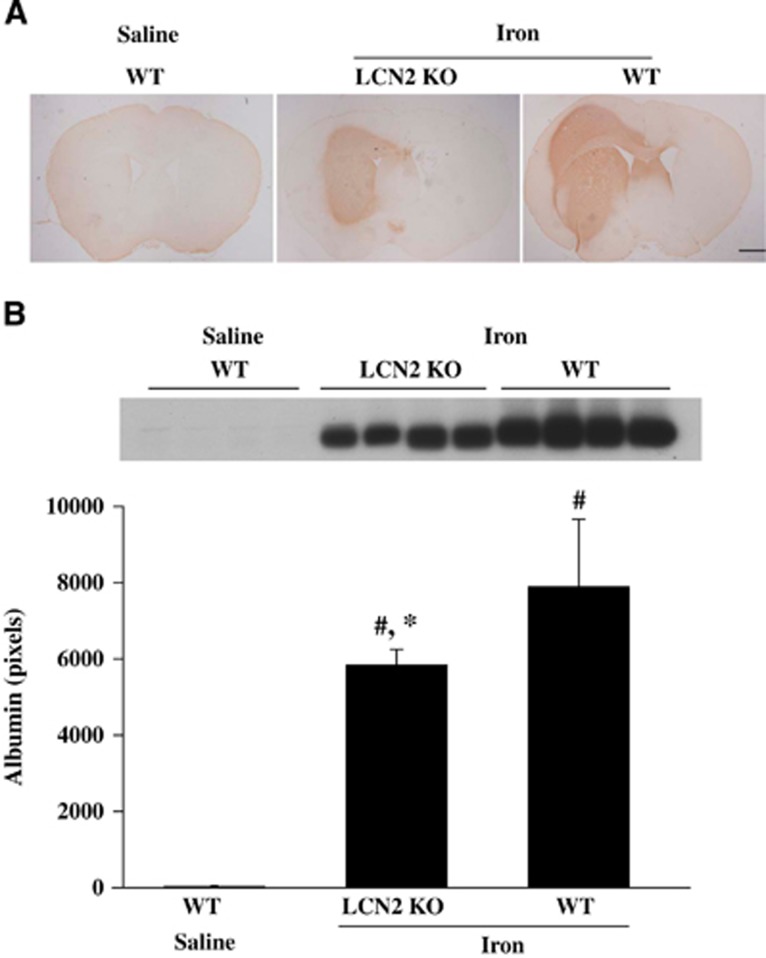
Figure 7.
Albumin immunoreactivity (A) and protein levels (B) in the ipsilateral basal ganglia of WT and lipocalin-2 knockout (LCN2−/−) mice that had 10 μL FeCl2 (1 mmol/L) or saline injected into the right basal ganglia. Values are mean±s.d., n=4, #P<0.01 versus WT saline group, *P<0.05 versus WT Iron group.

