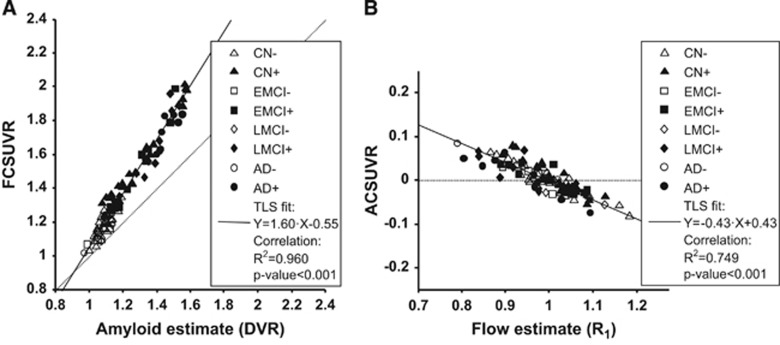
Figure 4.
Regression of corrected SUVR50–70 values against estimates of amyloid and relative flow, respectively. Scatter plots show global cortical variables in all subjects (N=101). Individual symbols indicate group membership and amyloid positivity (see legend for details). Solid line shows total least squares (TLS) fitted line (equation in legend, together with results of simple linear correlation). (A) SUVR50–70 values after removing flow-dependent component (FCSUVR) versus amyloid binding estimates (DVR). (B) SUVR50–70 values after removing amyloid-dependent component (ACSUVR) versus relative blood flow estimates (R1). AD, Alzheimer's disease; CN, cognitively normal; EMCI, early mild cognitive impairment; LMCI, mild cognitive impairment; SUVR, standardized uptake value ratio.

