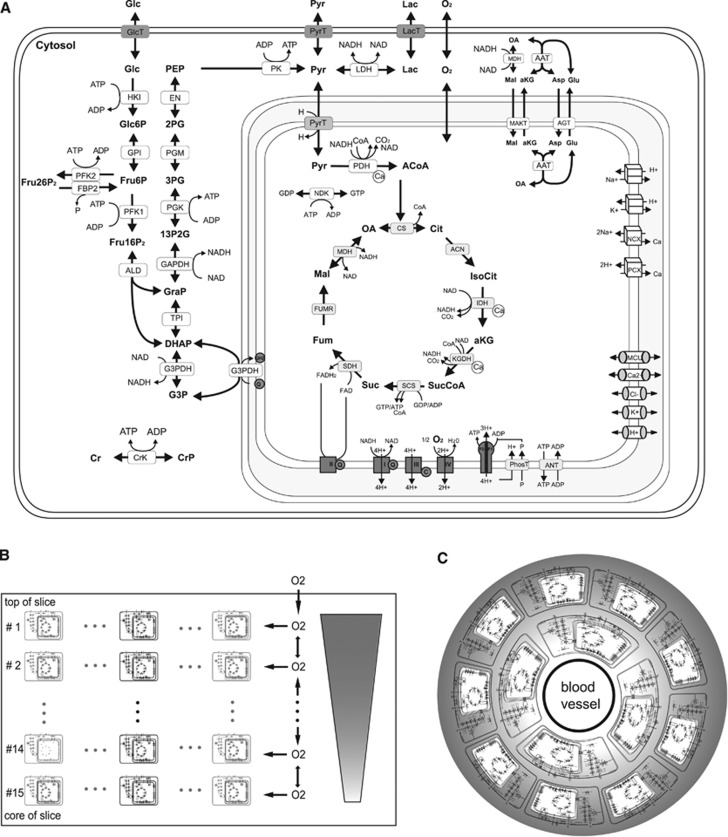
Figure 1.
(A) Reactions and transport processes included in the single-cell kinetic model. The model comprises the following subsystems: conversion of glucose to pyruvate/lactate in glycolysis including the formation of fructose 2,6-bisphosphate (Fru26P2), a potent activator of phosphofructokinase-1 (PFK1), shuttles of electrons (NAD-bound hydrogen) between the cytosol and the mitochondrial matrix combining the activities of the malate/α-ketoglutarate carrier (MAC), the mitochondrial aspartate amino transferase (AAT), the antitransport of glutamate (Glu) and aspartate (Asp) by the aspartate/glutamate carrier (AGC), the glycerol-3-phosphate (G3P) shuttle comprising mitochondrial and cytosolic G3P dehydrogenases (G3PDH), the TCA cycle starting with the formation of citrate (Cit) from oxaloacetate (OA) and acetyl-CoA (ACoA) and replenishing OA in a circular chain of reactions yielding electrons in terms of ubiquinol (QH2) and NADH and two molecules CO2; the respiratory chain composed of four complexes of which complexes I, III, and IV function as proton pumps. The resulting proton gradient and mitochondrial membrane potential (Vmm) determine the rate of proton-assisted ion transport of Na+, K+, Ca2+, and phosphate (P) across the inner mitochondrial membrane, the rate of the adenine nucleotide exchanger (NE) exchanging mitochondrial ATP against cytosolic ADP and the rate of F0F1-ATPase using three protons per generation per ATP. The membrane potential Vmm is also influenced by the exchange of cations and anions across the inner mitochondrial membrane through ion channels. Lactate is exchanged with the external space by the monocarboxylate transporter, MCT2. Within the cell, it is reversibly converted into pyruvate by the lactate dehydrogenases LDHA and LDHB. (B) Schematic representation of the slice model used to simulate spatial oxygen gradients within a brain slice. The slice model dissects the slice from the top to the slice core into a series of 15 thin layers. Assuming spatial isotropy in cell layers parallel to slice surface, all neuronal cells present in a given layer are represented by a single ‘representative' cell (marked black) so that the three-dimensional slice can be approximated by a one-dimensional row of cells, which are diffusively coupled. The metabolism of the cell representing one layer of cells is described by the cellular metabolic model used in the single-cell simulations of the preceding sections. Oxygen diffuses from the top to the bottom of the slice. The same model architecture was used in our previous work.14 (C) Schematic representation of the tissue model used to simulate in vivo NADH transients. The tissue model dissects the tissue in 10 concentric hollow cylinders around a central blood vessel with a wall thickness of 3.5 μm giving a total tissue of 35 μm corresponding to half of the average intercapillary distance.15 Oxygen supply is modeled by diffusional exchange between these cylinders and each hollow cylinder is equipped with the single-cell metabolic system. In contrast to the slice model, the discretization size is smaller than a single cell and a single cell comprises multiple discretization layers. This is necessary as the gradient across the length of one cell is not negligible.

