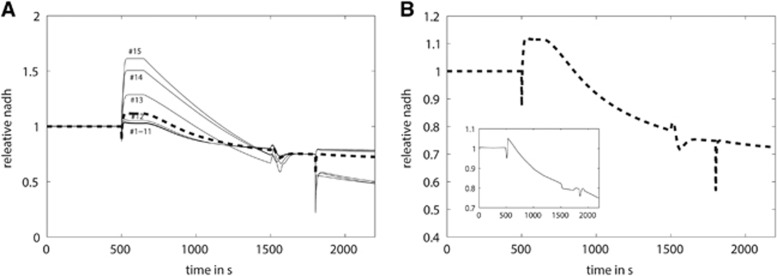
Figure 6.
The impact of pyruvate infusion on the NADH response. (A) At time t=500 seconds, all cells in the slice were exposed to a 1.75-fold increase in the activation function for 1,000 seconds mimicking the extra ATP consumption induced by an electrical stimulation. At the same time, the extracellular pyruvate concentration was successively increased from 0.2 to 6 mmol/L. At t=1,800 seconds, a second increase in the activation function was applied mimicking a second electrical stimulation. The relative NADH transients from different cells in the slice are depicted. (B) Cumulative concentration profile of mitochondrial NADH in the whole slice normalized to the preexcitation state. The insert shows the measured NAD(P)H fluorescence profile measured by Lipton.36

