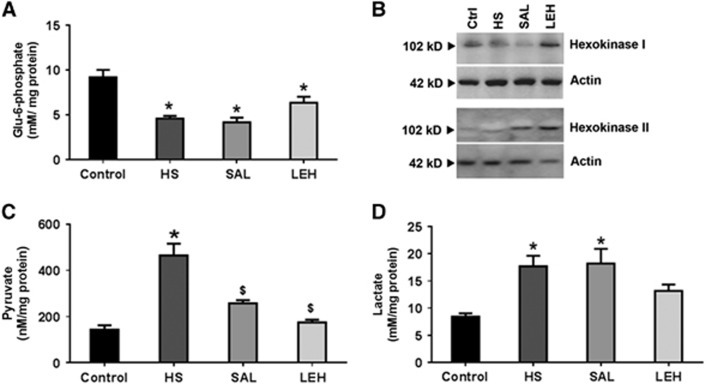
Figure 2.
(A) Glucose-6-phosphate content (n⩾4 per group), (B) a representative immunoblot of hexokinases I and II expression from three different sets, (C) pyruvate (n⩾5 per group), and (D) lactate (n⩾5 per group) in brain tissue after hypovolemic shock (HS) and liposome-encapsulated hemoglobin (LEH) or saline resuscitation. P<0.05 versus Ctrl* and versus HS$ (ANOVA, Bonferroni correction).

