
Fig. 5.
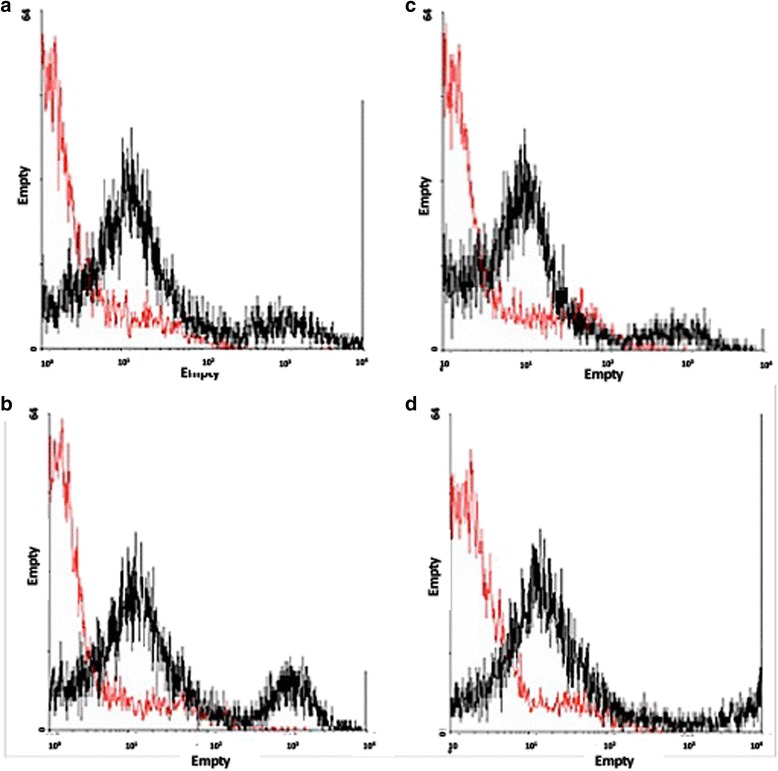
Isotype controls. a and (b) Red line corresponds to the IgG2a isotype control (mouse) and in black the specific binding in samples of synovial membrane and fluid, respectively. c and (d) Red line corresponds to the IgM isotype control (mouse) and in black the specific binding in samples of synovial membrane and fluid, respectively