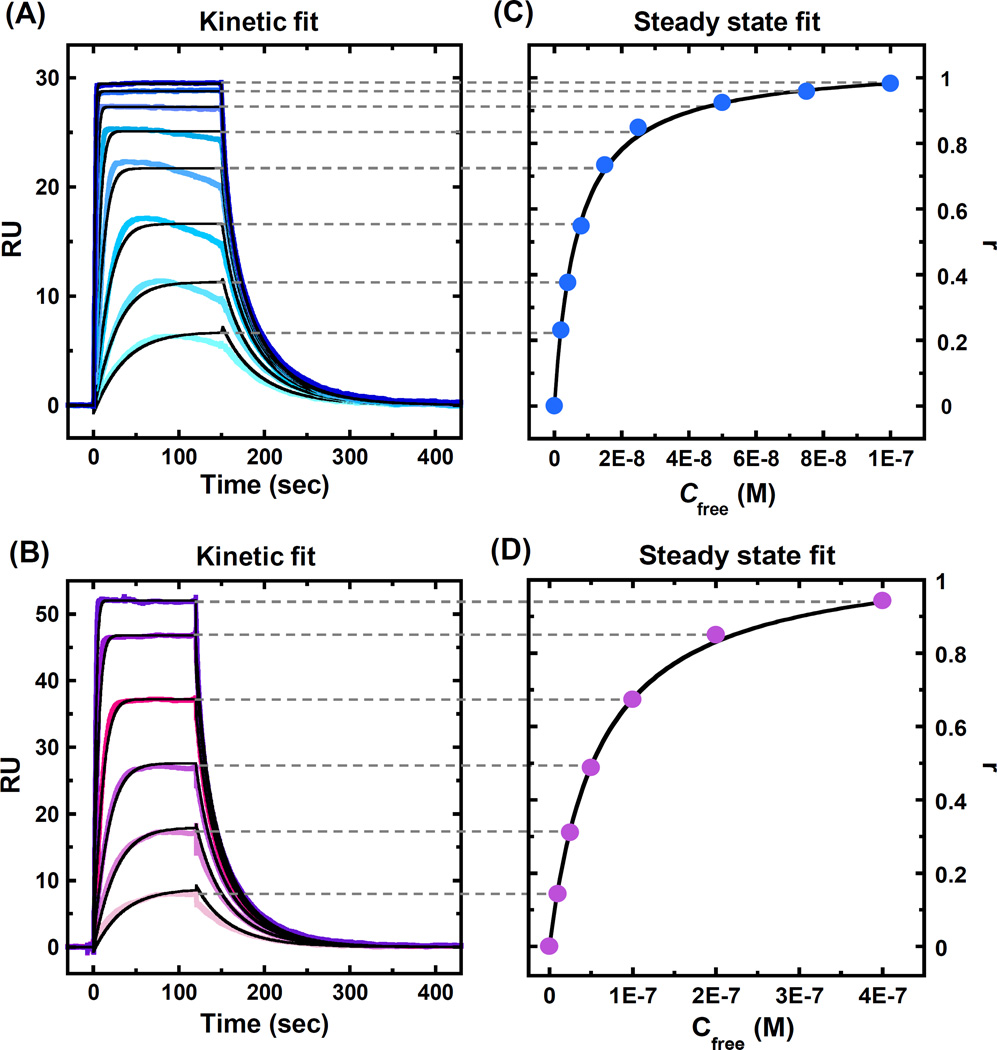
Figure 4.
Sensorgrams (color) and global kinetic fitting (black overlays) in a 1:1 binding model for PU.1 binding to the target DNA sequence with (A) 400 mM NaCl and (B) 400 mM NaCl in the presence of 300 µM salmon sperm DNA as non-specific DNA. The PU.1 concentrations from bottom to top are (A) 2, 4, 8, 15, 25, 50, 75 and 100 nM, and (B) 10, 25, 50, 100, 200 and 400 nM. (C) and (D) Steady state fitting of the sensorgrams in Figures 4A and 4B, respectively. RU values from the steady state region were converted to r (r = RUobs/RUmax) and are plotted as a function of unbound protein concentration with equilibrium in the complex.

