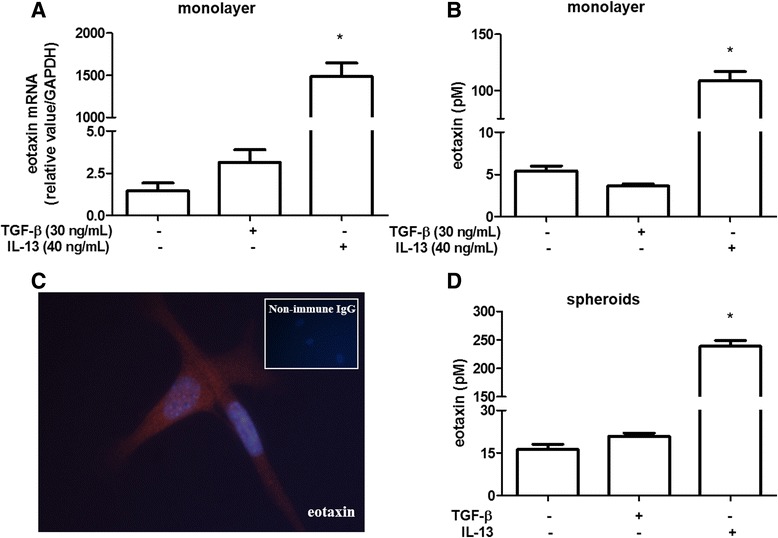
Fig. 5.

Eotaxin expression by GR-MF a Real time RT-PCR to determine the relative expression of eotaxin by GR-MF stimulated with TGF-β (30 ng/mL) and IL-13 (40 ng/mL). The relative value was obtained in relation to GAPDH expression. b Eotaxin levels measured by ELISA into supernatant of GR-MF stimulated with TGF-β (30 ng/mL) and IL-13 (40 ng/mL). c Immunolocalization of eotaxin in GR-MF. Magnification 600X. d Eotaxin levels measured by ELISA into supernatant of GR-MF spheroids stimulated with TGF-β (30 ng/mL) and IL-13 (40 ng/mL) after 4 days in culture. These graphs are representative of three experiments. *P ≤ 0.05 compared with non-stimulated cells
