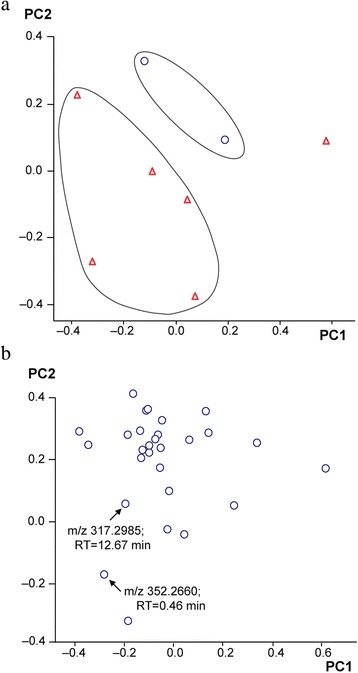
Fig. 1.

Principal Component Analysis (PCA) results. Score plot PC 1 vs PC 2 and (Data from cell samples (Δ) and control samples (O)) (a) (PC: principal component) and loading plot of PC 1 vs PC2 (b). Lower half of the loading plot shows some buckets discriminative (m/z: mass/charge and RT: retention time) in culture media samples. (ID: identity; FM: fertilization medium; MBI: medium before insemination; MAI: medium after insemination and MOS: medium only spermatozoa)
