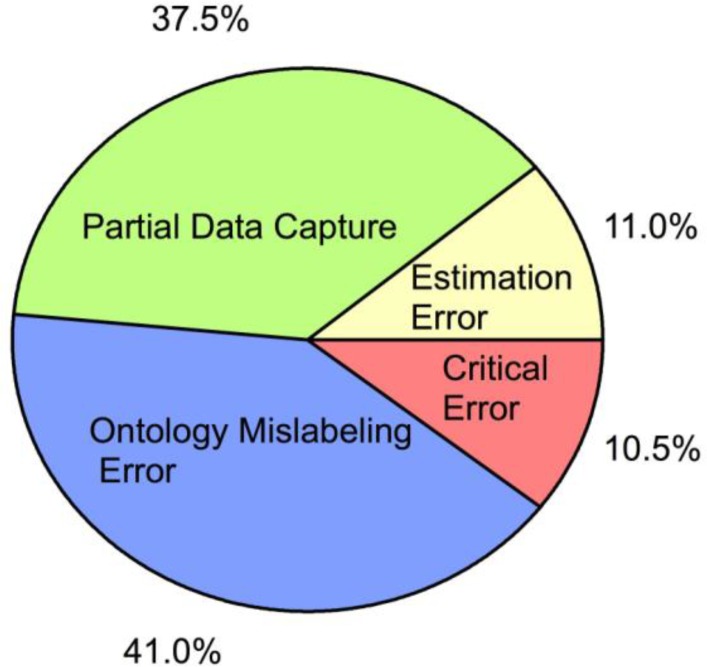
Figure 3.
Pie chart illustrating curator error types for Full Data Capture (Curation Levels 1–4, see curation section in Positions) for our SOD1 G93A transgenic mouse ALS experimental database as identified by quality control personnel. On average, trained curators commit errors on less than 1.2% of their entries with a standard deviation of ± 1%. The pie chart represents the breakdown of error type of this 1.2% of total errors. Partial Data Capture (green): curator fails to collect all data from a figure or table. For example, trendline data was recaptured only for G93A and not for G93A + treatment. Ontology mislabeling error (blue): curator assigns response value entry to wrong ontological classification. Estimation error (yellow): captured data point value (typically from a graph) is visually estimated as greater than ± 5% from the actual value. Note that value estimation off by more than 10% is defined as a critical error. Critical error (red): incorrectly entered data that compromises data integrity.

