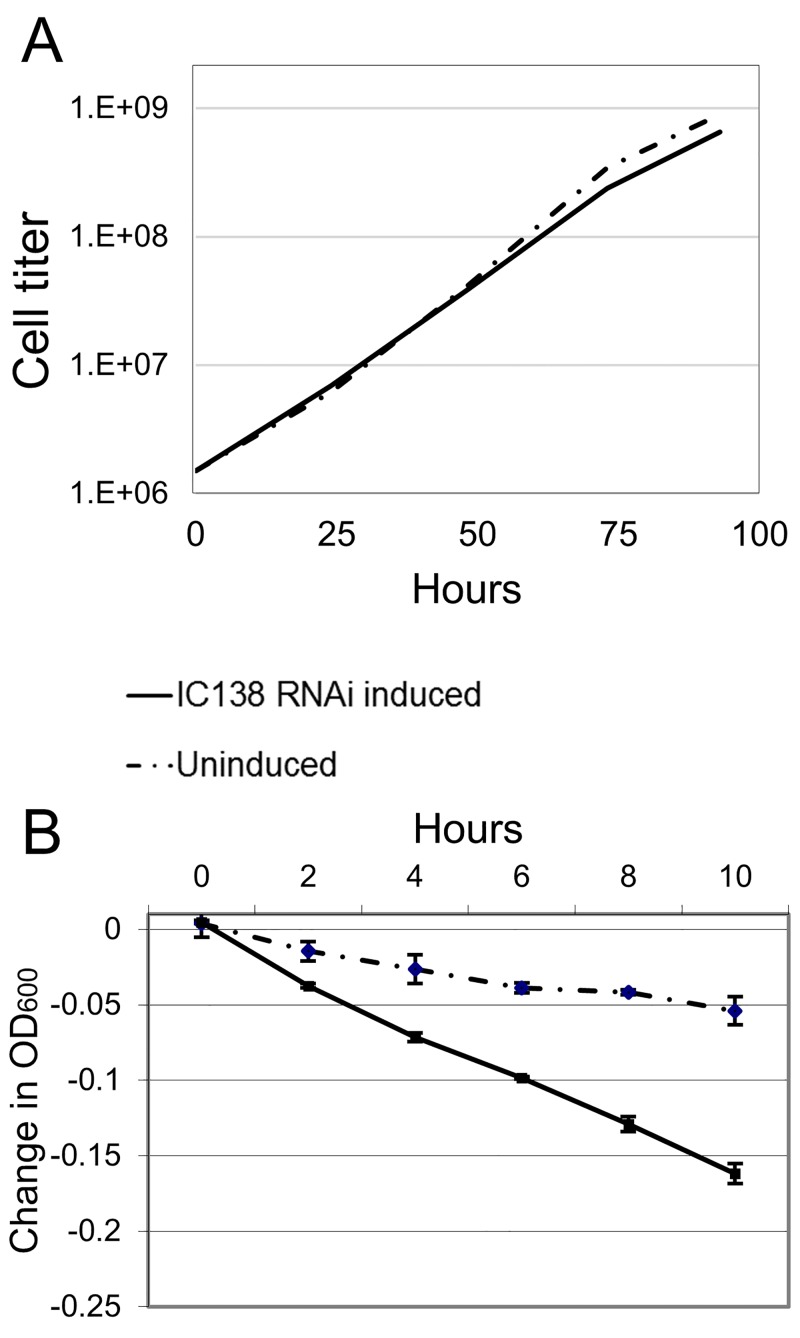
Fig 2. Growth and sedimentation analyses of TbIC138 knockdown.
A) A representative cumulative growth curve of IC138RNAi uninduced (dashed line) or tetracycline-induced (solid line). Cell titer = cells/mL. B) Sedimentation assay showing the motility of IC138RNAi cells in uninduced (dashed line) or induced (solid line) by monitoring absorbance at 600nm for a 10-hour period starting at 48 hours-post-induction. Error bars indicate standard deviation between replicate vials.

