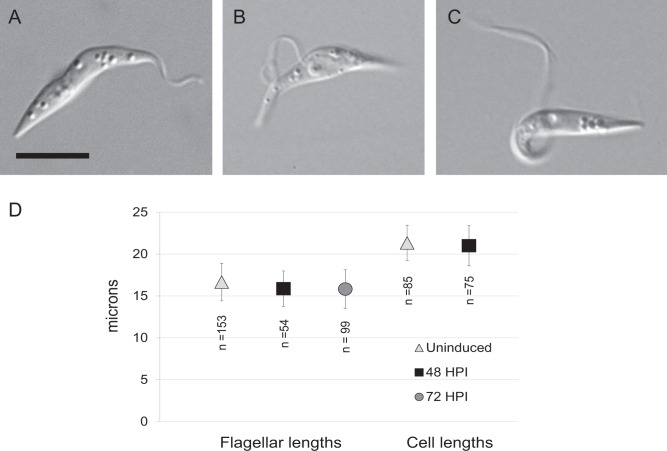
Fig 4. Morphological features of TbIC138 knockdown.
DIC images showing examples of attached (A), partially detached (B) and fully detached (C) flagella. Scale bar represents 5 μm. D) Graph showing flagellar lengths and total cell lengths of uninduced, 48 hours- and 72 hours-post-induction IC138RNAi cells. Error bars show standard deviation, number of samples (n) is indicated below each point.

