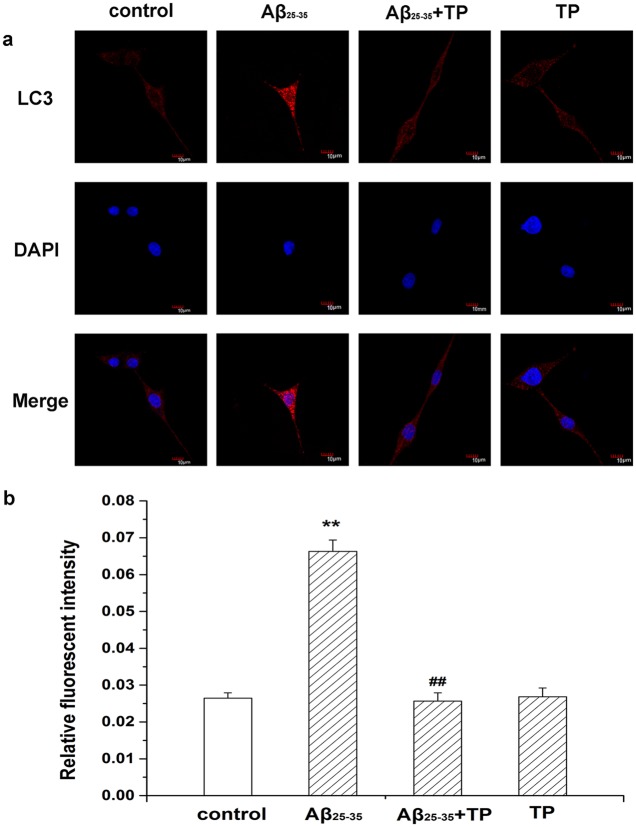
Fig 7. Expression of LC3 in differentiated PC12 cells.
Morphological evaluation of autophagy in differentiated PC12 cells by immunofluorescence was acquired by confocal microscopy. The immunohistochemical staining showed that LC3 was expressed in the control group (cells treated with culture medium), 10 μmol/L Aβ25–35 group, 10 μmol/L Aβ25–35+10−10 mol/L triptolide group and 10−10 mol/L triptolide group. Scale bar, 10 μm. Fig b was the corresponding linear diagram of relative fluorescent intensity. Data were presented as the means ±mean ± S.E.M. n = 7/group. *P < 0.05, **P < 0.01 vs. control group. ## P < 0.01 vs. 10 μmol/L Aβ25–35 group.

