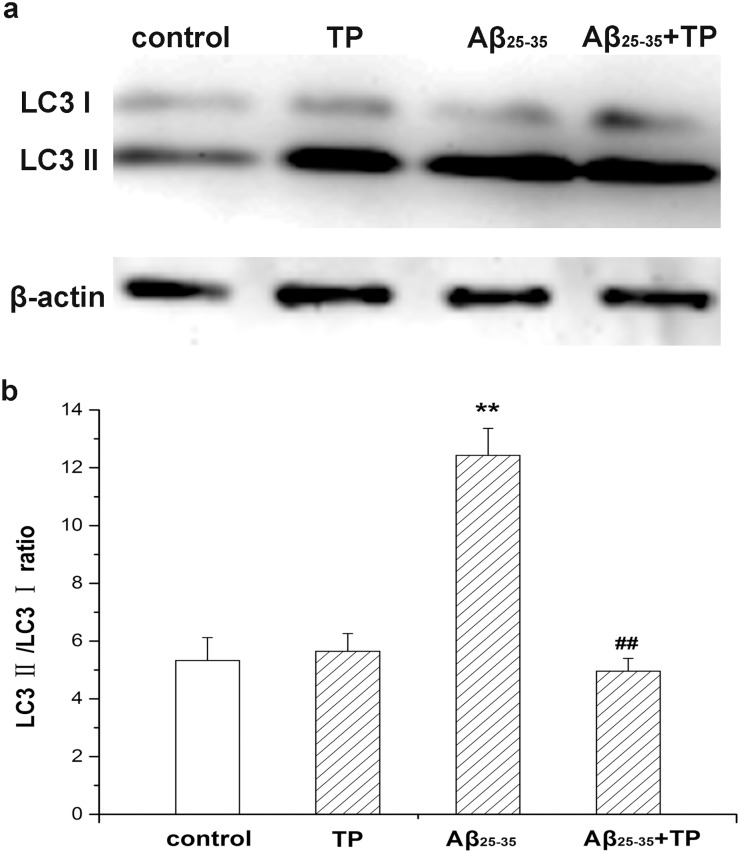
Fig 8. Ratio of LC3 II/LC3 I in differentiated PC12 cells.
Differentiated PC12 cells were determined by measuring expression of LC3 protein, which was the autophagosome marker, using Western blot analysis. Cells were incubated with culture medium, 10−10 mol/L triptolide, 10 μmol/L Aβ25–35, and 10 μmol/L Aβ25–35+10−10 mol/L triptolide for 24 hours. The corresponding linear diagram of immunoblotting quantitation is shown in (b). The ratio of LC3 II/LC3 I was evaluated by densitometry analysis and data were expressed as folds of the control. Data represents the mean ± S.E.M. n = 3/group. *P < 0.05, **P < 0.01 vs. control group. # P < 0.05, ## P < 0.01 vs. 10 μmol/L Aβ25–35 group.

