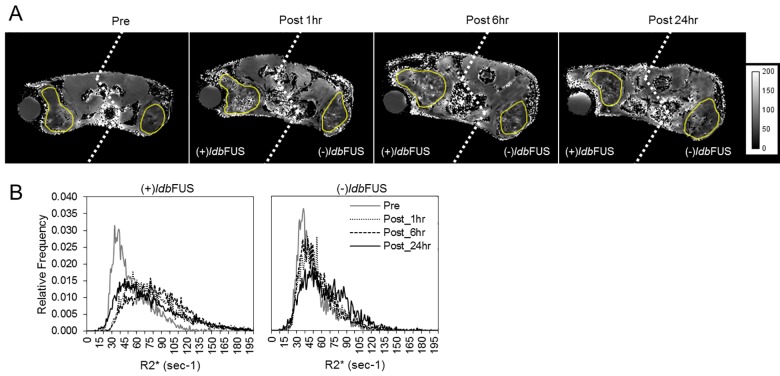
Fig 3. R2* maps and tumor histograms monitor changes in NK cell concentration.
(A) Representative parametric R2* images (axial slices) of an NSG mouse bearing bilateral flank LS-174T tumors before (pre), 1hr, 6hr, and 24hr post ldbFUS/Fe-NK administration. ldbFUS was induced at peak rarefication pressure of 0.50MPa. Yellow outlines show tumor regions of interest. Note that at some imaging time points left and right tumors were not in the same field of view–thus left & right sides (dashed line) may be from slightly different axial slices. Units in sec-1. (B) Histogram showing relative frequency R2* distributions of whole tumors from (A). The histogram shifts to increasing values of R2* with time in (+)ldbFUS tumor.

