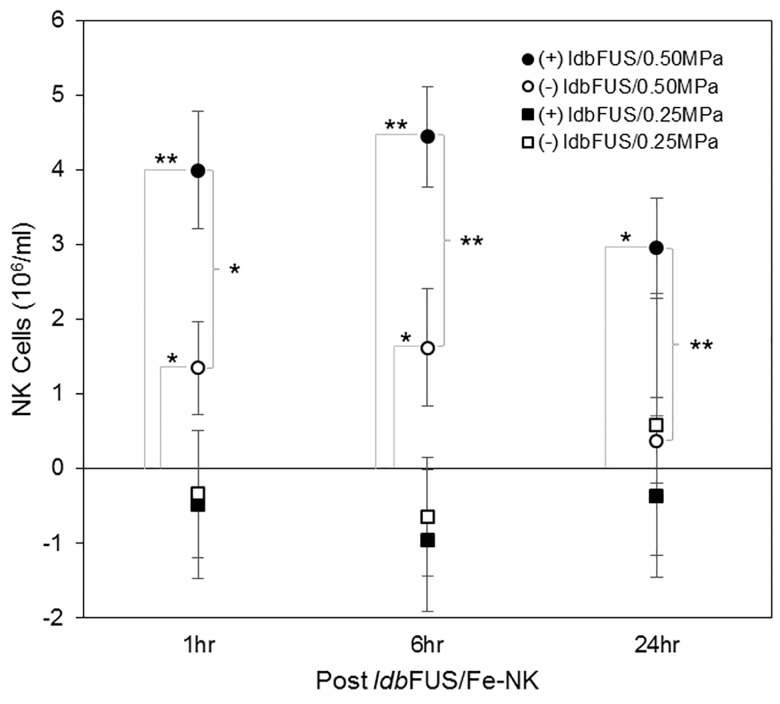
Fig 6. NK cell concentration in tumors determined from ΔR2*.
Although NK cell tumor distributions are heterogeneous as seen in Fig 3, R2* geometric means were obtained by fitting the R2* histogram to a lognormal distribution. NK cell concentrations (106/ml, mean±SD) in tumor tissue obtained from ΔR2* determination and the linear relationship between R2* and NK cell concentration shown in Fig 2. Planned comparisons were performed using the Student’s t-test. Significant differences are indicated by *p<0.05 and **p<0.01.

