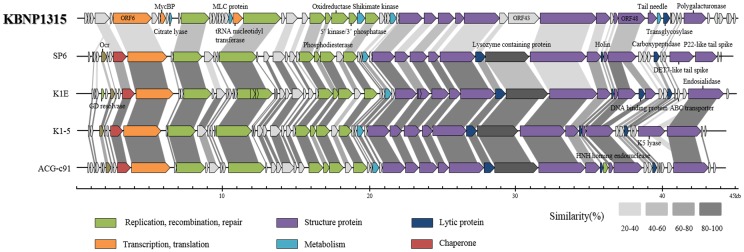
Fig 4. Comparative genome analysis among KBNP1315 and select relatives (KBNP1315, SP6, K1E, K1-5, and ACG-c91).
Each ORF is represented by a color assigned according to the protein function. The degree of amino acid similarity between paired ORFs was analyzed by BLASTp search, and the percentage of similarity is represented in color from pale gray to dark gray.

