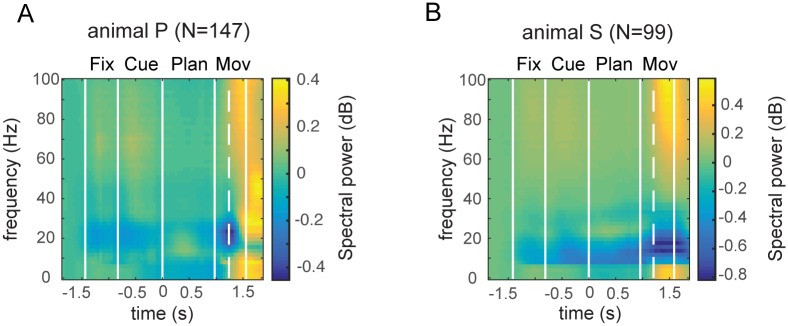
Fig 2. LFP spectrograms.
Averaged LFP spectrograms for animal P (A) and animal S (B), normalized to the baseline epoch (prior to fixation onset), and averaged across all recording sites (147 sites in animal P, 99 sites in animal S). Vertical solid lines indicate on- and offset of the fixation, cue, planning, and movement epochs; dashed line indicates movement onset (i.e., hand rest sensor release). Sharp transitions in the slow band are due to the applied multi-taper spectral analysis (time-frequency bandwidth 6.67Hz; see Methods).

