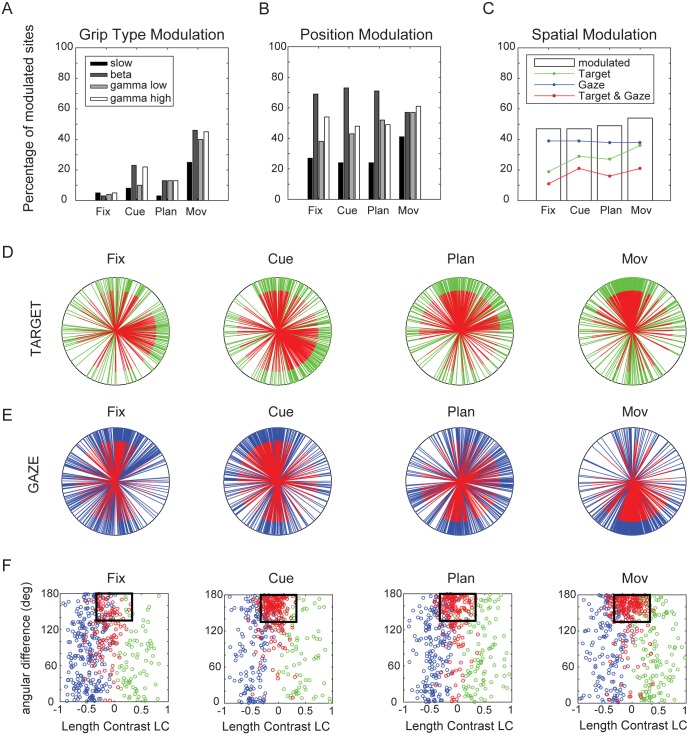
Fig 5. Linear model.
A. Percentage of all LFP sites (both animals, N = 246) that have a significant coefficient for grip type in the various frequency bands (slow, beta, low gamma, and high gamma band) and task epochs B. Percentage of sites with a significant spatial position coefficient. C. White bars indicate percentage of sites with significant spatial coefficients averaged across bands and animals for the different epochs fixation, cue, plan, and movement. Colored lines indicate fraction of sites with spatial coefficients for target (green), gaze (blue), and for both (red). D. Directional tuning of target modulated sites (all bands) for the task epochs fixation, cue, plan, and movement, as revealed by the linear fit. Tuning directions are derived from the target coefficient vectors (green: target modulated; red: target and gaze modulated). E. Directional tuning of gaze modulated sites (blue: gaze modulated; red: target and gaze modulated). F. Scatter plots of spatially tuned sites illustrating angular orientation difference (y-axis) between target (green) and gaze position vectors (blue) against the length contrast (LC) of these vectors (x-axis). Sites with significant target and gaze modulation (red) were considered retinotopic if the coefficient vectors were of comparable length (| LC | < 0.33) and oriented in nearly opposite direction (angular difference < 135deg), as indicated by the black rectangles.

