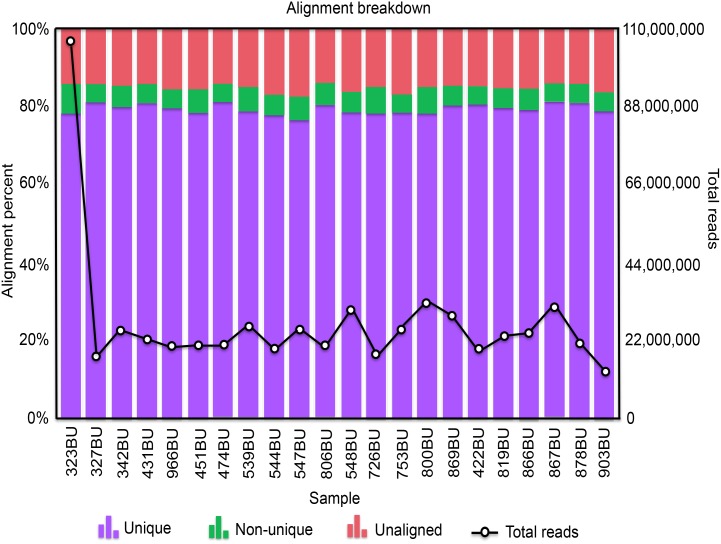
Fig 2. Alignment breakdown plot for all 22 samples.
The horizontal axis indicates the individual samples. The left vertical axis and columns show the proportion of reads for each sample with different alignment status. The right vertical axis and the line show the total number of reads for each sample.

