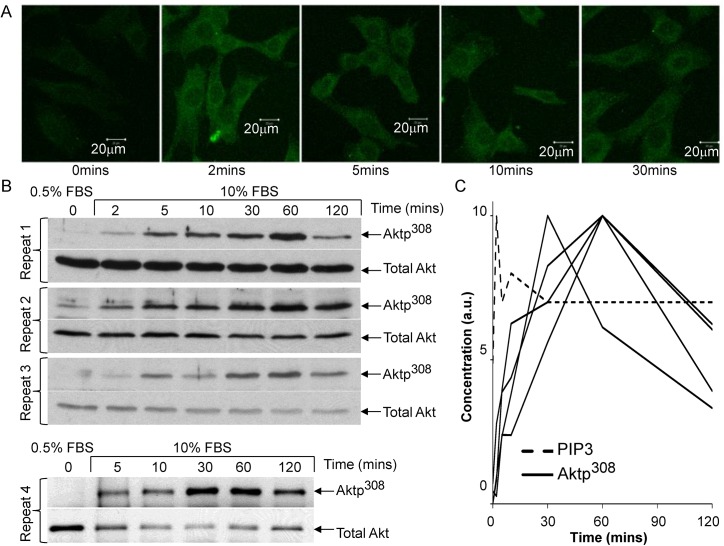
Fig 1. Akt pathway dynamics in serum-stimulated mouse embryonic fibroblasts (MEFs).
(A) Images of PIP3 immunofluorescence, representative of our replicates, and similar to previously reported dynamics for PIP3 [4,27]. For human readability, micrographs are shown with 5% increased brightness applied to all frames, but the fluorescence intensity was quantified using the unmodified micrographs. (B) Immunoblots of Aktp308 in serum-stimulated mouse embryonic fibroblasts (MEFs), repeated 4 times. Cells were grown initially in 10% fetal bovine serum (FBS), then incubated 24 hours in culture medium containing 0.5% FBS. Then 10% FBS was re-introduced (“serum stimulation”) and subsequent measurements were taken, relative to the serum stimulation. Time t = 0 indicates cells in 0.5% FBS without serum stimulation. (C) Quantified time-series of PIP3 (dotted line) and Aktp308 (4 solid lines for 4 experimental replicates) in arbitrary units (a.u.). The densitometry of Aktp308 was normalized by the densitometry of total Akt, and then rescaled such that the highest level in each time-series was equal to 10.0 (for consistency with the previous model by Hatakeyama et al.) Note that the earliest of the Aktp308 curves peaks at 30 minutes.

