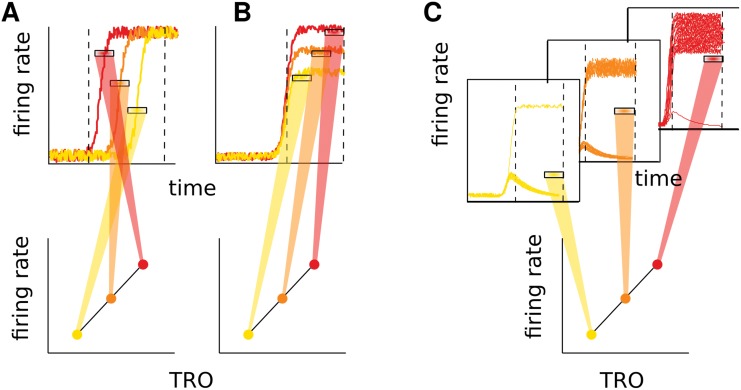
Fig 4. Pictorial representation of possible mechanisms underlying the correlation with difficulty.
The figure only illustrates a linear relation between FR and TRO. Panel A: Switch timing code. In the upper panel the time evolution of the FR is shown for three trials (one for each TRO; the color code is the same of the bottom panel). Each trial presents a switch from a state of low activity to a state of high activity. The three horizontal marks show the time averaged FRs taken in the window enclosed in the vertically dashed lines. In the bottom panel the average FRs are shown as a function of TRO. The different switch times of the trials produce different FRs. Panel B: Rate code; each trial reaches a different level of FR in the high activity state (upper panel) and this is reflected in the mean FR (bottom panel). Panel C: Binary code; only some trials switch to the high activity state while others remain in the down state. The number of trials that switch states depends on TRO. When many trials are in an up state (red trials) the mean-over-trials of the time averaged FR is higher in respect to the case of many of the trials in the down state (yellow trials).

