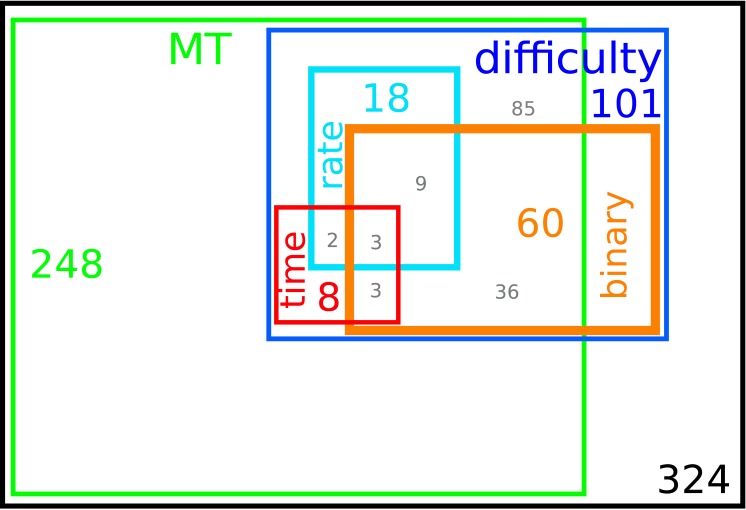
Fig 8. Graphical representation of the different classes of neurons.
The colored label and number in each rectangle indicate respectively the class (neurons encoding MT, neurons encoding the difficulty, neurons using a rate code, switch timing code and binary code) and the number of neurons in that set. Gray numbers indicate the number of neurons in the intersections, e.g. twelve neurons are in the intersection between the rate and binary populations and three neurons use all three mechanisms (rate, switching time and binary). Out of the 101 difficulty neurons only 56 could be analyzed with HMM, as explained in the text.

