
Fig 2. Effect of Sch B on (A) acetylcholinesterase (AChE) (B) acetylcholine (ACh), and (C) nitrite levels in Aβ/vehicle infused rats.
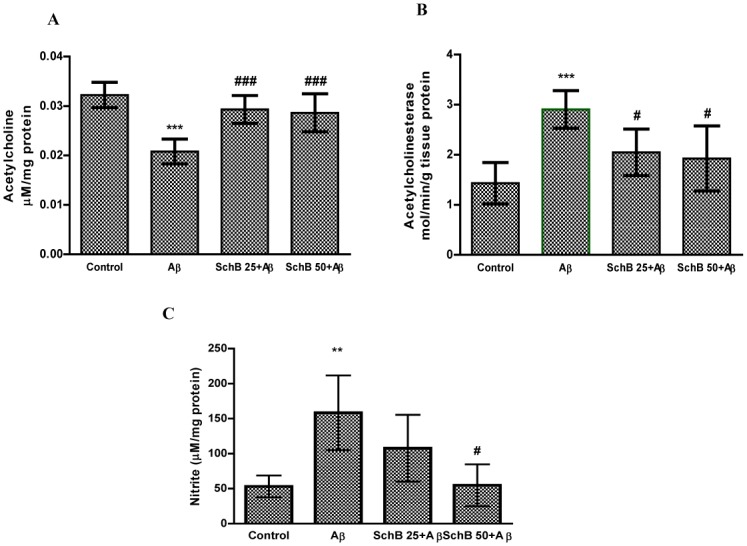
Data are represented as the mean ± SD (n = 5–6). *** P < 0.001, **P < 0.01, statistically different from control group. ### P < 0.001, # P < 0.05 statistically different from Aβ-infused rats.