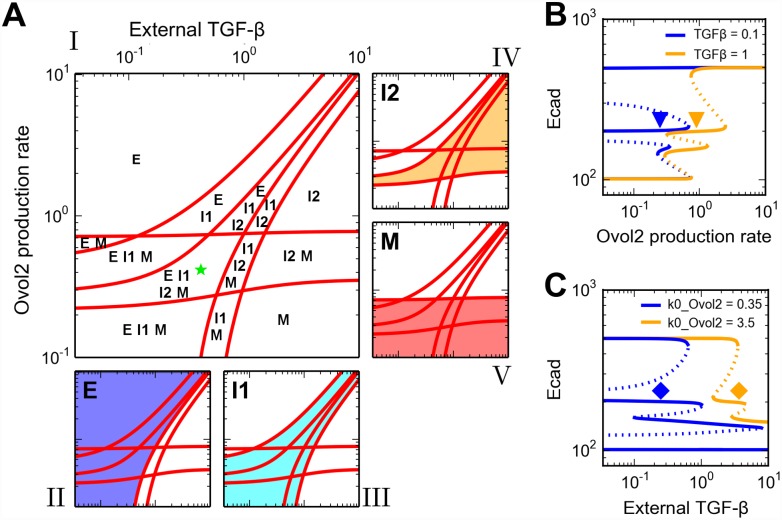
Fig 6. Roles of EMT-promoting and -inhibiting factors in the four-state EMT system.
A) Two-parameter bifurcation diagram with respect to external TGF-β and Ovol2 basal production rate. The red curves were computed by extending the saddle-node bifurcation points obtained in one parameter bifurcation analysis (S4 Fig), and they define different parameter regions that can be mono-stable, bi-stable, tri-stable or tetra-stable depending on the number of possible stable phenotypes (see labels), and each multi-stable region can be viewed as an area where multiple phenotypes co-exist (II-V). The size of each phenotype region is an indication of robustness of the phenotype when the two signals are varied. Green star: a basal parameter set and an intermediate TGF-β concentration that together give rise to four phenotypes. B, C) One-parameter bifurcation diagrams of Ecad with respect to external TGF-β (B) and Ovol2 basal production rate (C). Solid curve: stable steady state. Dashed curve: unstable steady state. A basal parameter set (blue) and a perturbed parameter set (orange) are compared in each plot. Triangles and diamonds denote the conditions under which both I1 and I2 are stable.

