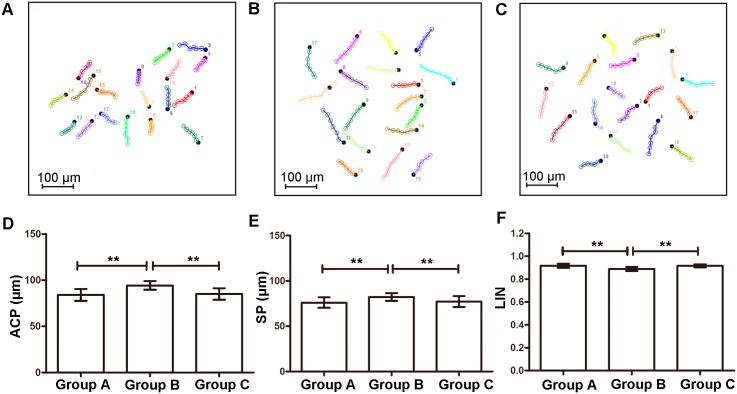
Fig 6. Chemokinetic response of spermatozoa to progesterone gradients.
(A-C) Representative trajectories of sperm in Group A, B and C (18 sperm in each plot). Each colored line is a cell trajectory that is 3 s long. Black dots are the endpoints of the trajectories. (D-F) Different chemokinetic parameters were compared among three groups. Group A, 100 pM progesterone solution was added in peripheral channels; Group B, 1 mM progesterone solution was added; Group C, control. Data are presented as mean ± SD (n = 5). **: p < 0.05.

