
Fig. 3. Strain-thickness phase diagram.
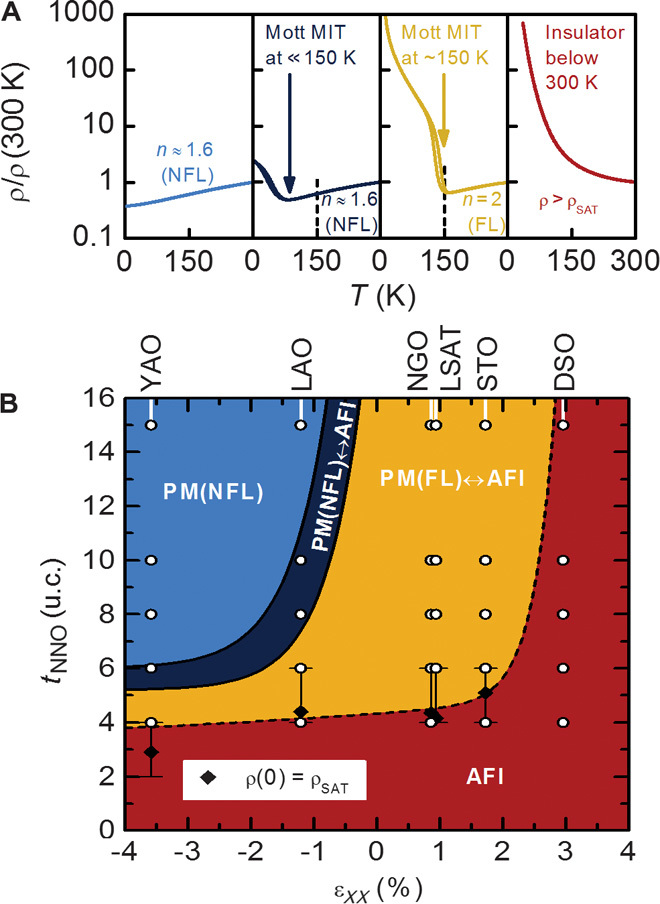
(A) Prototypes for the four basic behaviors seen in the ρ-T curves shown in Fig. 1. (B) Phase diagram for εxx versus tNNO. The boundaries are drawn between the four basic behaviors shown in (A). Each point indicates a transport curve in Fig. 1. Black diamonds represent predictions for MIT based on ρ(0) = ρSAT.