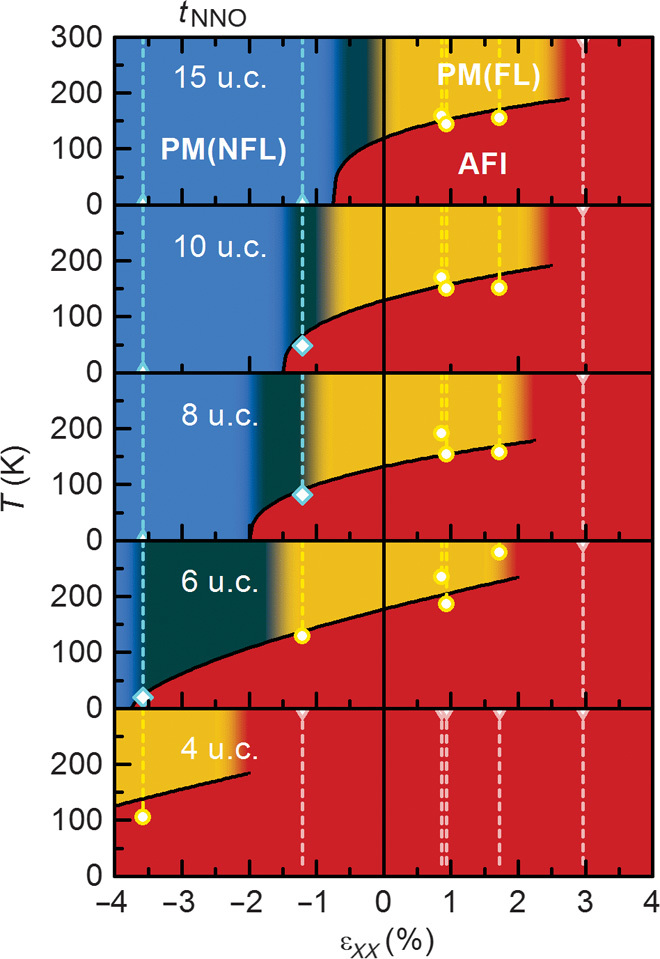
Fig. 4. Strain-temperature phase diagram.

Each panel corresponds to a different NdNiO3 (NNO) thickness. Symbols indicate MIT temperatures measured for films under different strains. The colors of the regions correspond to those in Fig. 3, and boundaries are drawn to be consistent with Fig. 3. YAO, YAlO3; LAO, LaAlO3; NGO, NdGaO3; LSAT, (LaAlO3)0.3(Sr2AlTaO6)0.7; STO, SrTiO3; DSO, DyScO3.
