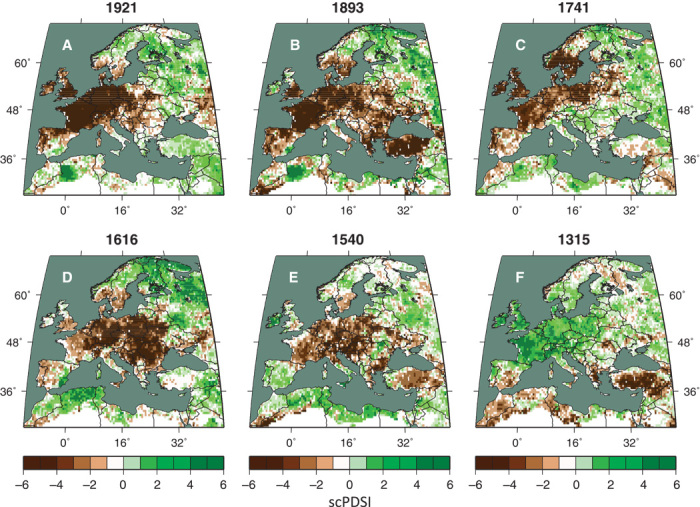
Fig. 2. OWDA maps of known years of hydroclimatic extremes.

(A to F) The maps are presented in reverse chronological order based on documentary climate records: from the best years recorded by instrumental climate records [1921 (A) and 1893 (B)] to the lesser known years [1741 (C), 1616 (D), 1540 (E), and 1315 (F)]. See the text for details and refer to Supplementary Materials for more examples of historical droughts from documentary records.
